EXHIBIT 96.1
|
|
|
This Amended S-K 1300 Initial Assessment Mineral Resource Report of the “LOST CREEK ISR URANIUM PROPERTY, SWEETWATER COUNTY, WYOMING, USA” dated September 19, 2022 has been prepared under the supervision of, and signed by the following Qualified Persons:
Prepared under the Supervision of:
WWC Engineering
1849 Terra Avenue
Sheridan, WY 82801
USA
Report Prepared for:

10758 W. Centennial Road
Suite 200
Littleton, CO 80127
|
|
|
TABLE OF CONTENTS
| 1.0 | EXECUTIVE SUMMARY |
|
| 1 |
| |||
| 2.0 | INTRODUCTION |
|
| 9 |
| |||
| 2.1 | Registrant |
|
| 9 |
| |||
|
| 2.2 | Terms of Reference |
|
| 9 |
| ||
|
| 2.3 | Information Sources and References |
|
| 9 |
| ||
|
| 2.4 | Inspection of the Property by Each Qualified Person |
|
| 10 |
| ||
|
| 2.4.1 | QP Qualifications |
|
| 10 |
| ||
|
| 2.5 | Previous Technical Report Summaries |
|
| 10 |
| ||
| 3.0 | PROPERTY DESCRIPTION AND LOCATION |
|
| 11 |
| |||
|
| 3.1 | Location and Size |
|
| 11 |
| ||
|
| 3.2 | Mining Claims, Mineral Leases and Surface Use Agreements |
|
| 16 |
| ||
|
| 3.3 | Title to Property |
|
| 20 |
| ||
|
|
| 3.3.1 | Property Boundaries |
|
| 20 |
| |
|
| 3.4 | Royalties, Taxes and Fees |
|
| 20 |
| ||
|
| 3.5 | Significant Encumbrances or Risks to Perform Work on the Property |
|
| 21 |
| ||
|
|
| 3.5.1 | Environmental Liabilities |
|
| 21 |
| |
|
|
| 3.5.2 | Existing and Required Permits |
|
| 21 |
| |
|
|
| 3.5.3 | Significant Risks that May affect Access, Title, or Right to Perform Work |
|
| 22 |
| |
| 4.0 | ACCESSIBILITY, CLIMATE, LOCAL RESOURCES, INFRASTRUCTURE AND PHYSIOGRAPHY |
|
| 23 |
| |||
|
| 4.1 | Physiography |
|
| 23 |
| ||
|
| 4.2 | Means of Access |
|
| 23 |
| ||
|
| 4.3 | Proximity to Population Centers |
|
| 23 |
| ||
|
| 4.4 | Climate and Operating Season |
|
| 24 |
| ||
|
| 4.5 | Property Infrastructure |
|
| 24 |
| ||
|
|
| 4.5.1 | Water Supply |
|
| 25 |
| |
| 5.0 | HISTORY |
|
| 26 |
| |||
|
| 5.1 | Ownership History |
|
| 26 |
| ||
|
|
| 5.1.1 | Ownership History of Lost Creek Project |
|
| 26 |
| |
|
|
| 5.1.2 | Ownership History of Adjoining Projects |
|
| 27 |
| |
|
|
| 5.1.2.1 | LC East |
|
| 27 |
| |
|
|
| 5.1.2.2 | LC North |
|
| 27 |
| |
|
|
| 5.1.2.3 | LC South |
|
| 28 |
| |
|
|
| 5.1.2.4 | LC West |
|
| 28 |
| |
|
|
| 5.1.2.5 | EN |
|
| 28 |
| |
| Ur-Energy – Lost Creek ISR Uranium Property Amended Technical Report Summary – September 19, 2022 | Page i |
|
|
|
TABLE OF CONTENTS (Continued)
| 5.2 | Exploration History |
|
| 28 |
| |||
|
| 5.3 | Previous Mineral Resource Estimates and Their Reliability |
|
| 30 |
| ||
|
| 5.4 | Production History |
|
| 30 |
| ||
| 6.0 | GEOLOGICAL SETTING AND MINERALIZATION |
|
| 32 |
| |||
|
| 6.1 | Regional Geology |
|
| 32 |
| ||
|
| 6.2 | Project Geology |
|
| 32 |
| ||
|
| 6.3 | Stratigraphy |
|
| 37 |
| ||
|
| 6.4 | Mineralization of the Lost Creek Property |
|
| 41 |
| ||
|
| 6.5 | DEPOSIT TYPE |
|
| 43 |
| ||
| 7.0 | EXPLORATION |
|
| 46 |
| |||
|
| 7.1 | Drilling |
|
| 46 |
| ||
|
|
| 7.1.1 | Historic Drilling |
|
| 46 |
| |
|
|
| 7.1.1.1 | Lost Creek Project: Drilling History |
|
| 46 |
| |
|
|
| 7.1.1.2 | LC East Project: Drilling History |
|
| 47 |
| |
|
|
| 7.1.1.3 | LC North Project: Drilling History |
|
| 47 |
| |
|
|
| 7.1.1.4 | LC South Project: Drilling History |
|
| 48 |
| |
|
|
| 7.1.1.5 | LC West Project: Drilling History |
|
| 48 |
| |
|
|
| 7.1.1.6 | EN Project: Drilling History |
|
| 48 |
| |
|
|
| 7.1.2 | Drilling By URE |
|
| 48 |
| |
|
| 7.2 | Hydrogeology |
|
| 49 |
| ||
|
| 7.2.1 | Hydraulic Properties |
|
| 50 |
| ||
|
|
| 7.2.2 | QP Comment on Results |
|
| 52 |
| |
|
| 7.3 | Geotechnical Data, Testing, and Analysis |
|
| 52 |
| ||
|
| 7.4 | Disequilibrium |
|
| 52 |
| ||
| 8.0 | SAMPLE COLLECTION, PREPARATION, ANALYSIS AND SECURITY |
|
| 54 |
| |||
|
| 8.1 | Down-hole Geophysical Logging |
|
| 54 |
| ||
|
| 8.2 | Coring |
|
| 55 |
| ||
|
| 8.3 | Drill Cuttings |
|
| 55 |
| ||
|
| 8.4 | Analyses and Security |
|
| 55 |
| ||
|
| 8.5 | Quality Control Summary |
|
| 56 |
| ||
|
| 8.6 | Opinion on Adequacy |
|
| 56 |
| ||
| Ur-Energy – Lost Creek ISR Uranium Property Amended Technical Report Summary – September 19, 2022 | Page ii |
|
|
|
TABLE OF CONTENTS (Continued)
| 9.0 | DATA VERIFICATION |
|
| 57 |
| |||
| 10.0 | MINERAL PROCESSING AND METALLURGICAL TESTING |
|
| 58 |
| |||
| 11.0 | MINERAL RESOURCE ESTIMATES |
|
| 59 |
| |||
|
| 11.1 | Assumptions |
|
| 59 |
| ||
|
| 11.2 | Mineral Resource Estimates |
|
| 59 |
| ||
|
|
| 11.2.1 | Cutoff Selection |
|
| 59 |
| |
|
|
| 11.2.2 | Resource Classification |
|
| 60 |
| |
|
|
| 11.2.3 | Methodology |
|
| 61 |
| |
|
|
| 11.2.3.1 | Fundamentals |
|
| 61 |
| |
|
|
| 11.2.3.2 | Mineral Intercepts |
|
| 62 |
| |
|
|
| 11.2.3.3 | GT Contouring and Resource Estimation |
|
| 62 |
| |
|
| 11.2.4 | Summary of Resources |
|
| 64 |
| ||
|
| 11.2.5 | Resource Estimation Auditing |
|
| 66 |
| ||
|
| 11.2.6 | Mineral Resource Estimate Risk |
|
| 67 |
| ||
| 12.0 | MINERAL RESERVE ESTIMATES |
|
| 68 |
| |||
| 13.0 | MINING METHODS |
|
| 68 |
| |||
|
| 13.1 | Mineral Deposit Amenability |
|
| 68 |
| ||
|
| 13.2 | Mine Development |
|
| 68 |
| ||
| 13.3 | Piping |
|
| 73 |
| |||
|
| 13.4 | Header Houses |
|
| 73 |
| ||
|
| 13.5 | Wellfield Reagents, Electricity |
|
| 73 |
| ||
|
| 13.6 | Mining Fleet Equipment and Machinery |
|
| 73 |
| ||
|
| 13.7 | Mining Personnel |
|
| 73 |
| ||
| 14.0 | PROCESSING AND RECOVERY METHODS |
|
| 74 |
| |||
|
| 14.1 | Plant Processing |
|
| 74 |
| ||
|
| 14.2 | Energy, Water and Process Materials |
|
| 76 |
| ||
|
| 14.3 | Liquid Disposal |
|
| 77 |
| ||
|
| 14.4 | Solid Waste Disposal |
|
| 77 |
| ||
|
| 14.5 | Plant Personnel |
|
| 77 |
| ||
| Ur-Energy – Lost Creek ISR Uranium Property Amended Technical Report Summary – September 19, 2022 | Page iii |
|
|
|
TABLE OF CONTENTS (Continued)
| 15.0 | PROJECT INFRASTRUCTURE |
|
| 78 |
| |||
|
| 15.1 | Roads |
|
| 78 |
| ||
|
| 15.2 | Laboratory Equipment |
|
| 78 |
| ||
|
| 15.3 | Electricity |
|
| 78 |
| ||
|
| 15.4 | Water |
|
| 80 |
| ||
|
| 15.5 | Holding Ponds |
|
| 80 |
| ||
| 16.0 | MARKET STUDIES AND CONTRACTS |
|
| 81 |
| |||
| 17.0 | ENVIRONMENTAL STUDIES, PERMITTING, SOCIAL OR COMMUNITY IMPACT |
|
| 82 |
| |||
|
| 17.1 | Environmental Studies |
|
| 82 |
| ||
|
|
| 17.1.1 | Background Radiological Characteristics |
|
| 82 |
| |
|
|
| 17.1.2 | Threatened, Endangered, or Candidate Species |
|
| 83 |
| |
|
|
| 17.1.3 | Cultural and Historic Resources |
|
| 84 |
| |
|
|
| 17.1.4 | Visual and Scenic Resources |
|
| 84 |
| |
|
|
| 17.1.5 | Byproduct Disposal |
|
| 84 |
| |
|
| 17.2 | Permitting Requirements, Permit Status, Financial Assurance |
|
| 84 |
| ||
|
|
| 17.2.1 | Financial Assurance |
|
| 84 |
| |
|
|
| 17.2.3 | Site Monitoring |
|
| 85 |
| |
|
| 17.3 | Community Affairs |
|
| 85 |
| ||
|
| 17.4 | Project Closure |
|
| 86 |
| ||
|
|
| 17.4.1 | Well Abandonment / Groundwater Restoration |
|
| 86 |
| |
|
| 17.4.2 | Demolition and Removal of Infrastructure |
|
| 86 |
| ||
|
|
| 7.4.3 | Site Grading and Revegetation |
|
| 86 |
| |
|
| 17.5 | Adequacy of Current Plans |
|
| 86 |
| ||
| 18.0 | CAPITAL AND OPERATING COSTS |
|
| 87 |
| |||
|
| 18.1 | Capital Cost Estimation (CAPEX) |
|
| 87 |
| ||
|
| 18.2 | Operating Cost Estimation (OPEX) |
|
| 87 |
| ||
|
| 18.3 | Adequacy of Cost Estimates |
|
| 90 |
| ||
|
| 18.4 | Wellfield Development Costs |
|
| 90 |
| ||
| 19.0 | ECONOMIC ANALYSIS |
|
| 91 |
| |||
|
| 19.1 | Assumptions |
|
| 91 |
| ||
|
| 19.2 | Cash Flow Forecast and Production Schedule |
|
| 92 |
| ||
|
| 19.3 | Taxation |
|
| 95 |
| ||
| 19.4 | Sensitivity Analysis |
|
| 95 |
| |||
| Ur-Energy – Lost Creek ISR Uranium Property Amended Technical Report Summary – September 19, 2022 | Page iv |
|
|
|
TABLE OF CONTENTS (Continued)
| 20.0 | ADJACENT PROPERTIES |
|
| 97 |
| |||
| 21.0 | OTHER RELEVANT DATA AND INFORMATION |
|
| 97 |
| |||
| 22.0 | INTERPRETATION AND CONCLUSIONS |
|
| 98 |
| |||
|
| 22.1 | Conclusions |
|
| 98 |
| ||
|
| 22.2 | Risk Assessment |
|
| 98 |
| ||
|
|
| 22.2.1 | Resource and Recovery |
|
| 98 |
| |
|
|
| 22.2.2 | Markets and Contracts |
|
| 99 |
| |
|
|
| 22.2.3 | Operations |
|
| 100 |
| |
| 23.0 | RECOMMENDATIONS |
|
| 101 |
| |||
|
| 23.1 | Continued Wellfield Development |
|
| 101 |
| ||
|
| 23.2 | Continued Permitting |
|
| 101 |
| ||
| 24.0 | REFERENCES |
|
| 102 |
| |||
| 25.0 | RELIANCE ON INFORMATION PROVIDED BY THE REGISTRANT |
|
| 105 |
| |||
| 26.0 | DATE AND SIGNATURE PAGES |
|
| 105 |
| |||
LIST OF TABLES
| Table 1. | Lost Creek Property – Resource Summary |
|
| 4 |
|
| Table 2. | Summary of Economics |
|
| 5 |
|
| Table 3. | Cash Flow Summary |
|
| 7 |
|
| Table 4. | Drill Hole Summary – Historical and Recent |
|
| 29 |
|
| Table 5. | Previous Resource Estimates |
|
| 31 |
|
| Table 6. | KM Horizon - Leach Test Results, 2010 |
|
| 58 |
|
| Table 7. | Lost Creek Property Resources, by Project |
|
| 66 |
|
| Table 8. | Development Summary by Resource Area |
|
| 71 |
|
| Table 9. | Annual Operating Costs (OPEX) Summary |
|
| 88 |
|
| Table 10. | Annual Operating Costs (OPEX) Details |
|
| 89 |
|
| Table 11. | Cash Flow Statement ($US 000s) |
|
| 93 |
|
| Table 12. | Cash Flow Detail ($US 000s) |
|
| 94 |
|
| Table 13. | Net Present Value Discount Rate Sensitivity and IRR |
|
| 95 |
|
| Ur-Energy – Lost Creek ISR Uranium Property Amended Technical Report Summary – September 19, 2022 | Page v |
|
|
|
TABLE OF CONTENTS (Continued)
LIST OF FIGURES
| Figure 1. | General Location Map |
|
| 2 |
|
| Figure 2. | Site Access, Lost Creek Property |
|
| 12 |
|
| Figure 3a. | Lost Creek Project Surface and Mineral Ownership |
|
| 13 |
|
| Figure 3b. | LC East Project Surface and Mineral Ownership |
|
| 14 |
|
| Figure 3c. | LC North Project Surface and Mineral Ownership |
|
| 15 |
|
| Figure 3d. | LC South Project Surface and Mineral Ownership |
|
| 17 |
|
| Figure 3e. | LC West Project Surface and Mineral Ownership |
|
| 18 |
|
| Figure 3f. | EN Project Surface and Mineral Ownership |
|
| 19 |
|
| Figure 4. | Geologic Map of the Great Divide Basin |
|
| 33 |
|
| Figure 5. | Schematic Geologic Cross Section, Lost Creek Project |
|
| 34 |
|
| Figure 6. | Stratigraphic Chart of Lost Creek Project Specific Geology |
|
| 35 |
|
| Figure 7. | Type Log for the Lost Creek Project |
|
| 36 |
|
| Figure 8a. | Stratigraphic Cross Section A-A’ |
|
| 39 |
|
| Figure 8b. | Stratigraphic Cross Section B-B’ |
|
| 40 |
|
| Figure 9. | Resource Map for the Lost Creek Property |
|
| 42 |
|
| Figure 10. | Conceptual Uranium Roll Front Deposit |
|
| 45 |
|
| Figure 11. | GT Contour Resource Polygon |
|
| 64 |
|
| Figure 12. | Resource Areas – Lost Creek Property |
|
| 70 |
|
| Figure 13. | Life of Mine Schedule |
|
| 72 |
|
| Figure 14. | Process Flow Diagram |
|
| 75 |
|
| Figure 15. | Lost Creek Property Existing Infrastructure |
|
| 79 |
|
| Figure 16. | Pre-tax NPV Sensitivity to Price, OPEX and CAPEX |
|
| 96 |
|
| Figure 17. | Post-Tax NPV Sensitivity to Price, OPEX and CAPEX |
|
| 96 |
|
| Ur-Energy – Lost Creek ISR Uranium Property Amended Technical Report Summary – September 19, 2022 | Page vi |
|
|
|
LIST OF ABBREVIATIONS
| AEC | U.S. Atomic Energy Commission |
| ALARA | As Low As Reasonably Achievable |
| AQD | Air Quality Department |
| bgs | Below ground surface |
| BLM | U.S. Bureau of Land Management |
| CAPEX | Capital Expenditure |
| CIM | Canadian Institute of Mining, Metallurgy and Petroleum |
| COC | Chain of Custody |
| CPI | Consumer Price Index |
| DDCT | Density Disturbance Calculation Tool |
| DDW(s) | Deep Disposal Well(s) |
| DEF | Disequilibrium Factor |
| DOE | U.S. Department of Energy |
| eU3O8 | equivalent U3O8 as measured by a calibrated gamma instrument |
| EMC | Energy Metals Corporation |
| EMT | East Mineral Trend, located within the LC East Project |
| EPA | U.S. Environmental Protection Agency |
| ESA | Endangered Species Act |
| ft. | Feet |
| FTE | Full Time Equivalent |
| GDB | Great Divide Basin |
| GIS | Geographic Information System |
| gpm | Gallons Per Minute |
| GT | Grade x Thickness product (% ft.) of a uranium intercept (expressed without units) |
| HDPE | High density polyethylene pipe |
| HH(s) | Header house(s) |
| HPU | High Plains Uranium, Inc. |
| ICP | Inductively Coupled Plasma |
| ISL | In Situ Leach |
| ISR | In Situ Recovery |
| IRR | Internal Rate of Return |
| IX | Ion Exchange |
| K | Thousand |
| kWh | Kilowatt-hours |
| LC | Lost Creek ISR, LLC, operating company for Lost Creek Project; wholly-owned subsidiary of Ur-Energy Inc. |
| lbs. | Pounds |
| LoM | Life of Mine |
| M | Million |
| MMT | Main Mineral Trend, located within Lost Creek Project |
| MOU | Memorandum of Understanding |
| MU1 | Mine Unit 1, Lost Creek Project |
| MU2 | Mine Unit 2, Lost Creek Project |
| NI 43-101 | Canadian National Instrument 43-101 (Standards of Disclosure for Mineral Projects) |
| NPV | Net Present Value |
| NRC | U.S. Nuclear Regulatory Commission |
| OPEX | Operating Expenditure |
| PEA | Preliminary Economic Assessment (per NI 43-101) |
| Ur-Energy – Lost Creek ISR Uranium Property Amended Technical Report Summary – September 19, 2022 | Page vii |
|
|
|
LIST OF ABBREVIATIONS (Continued)
| PFN | Prompt Fission Neutron, logging technology |
| PNC | Power Nuclear Corporation |
| PVC | Polyvinyl chloride pipe |
| QP | Qualified Person or QP Firm |
| R | Range |
| RA | Resource Area |
| SBS | Sage Brush Shale |
| S-K 1300 | Regulation S-K Subpart 1300, “Modernization of Property Disclosures for Mining Registrants” |
| SME | Society for Mining, Metallurgy & Exploration |
| SR | State Route |
| T | Township |
| T&E | Threatened and Endangered Species |
| U | Uranium in its natural isotopic ratios |
| U1 | Uranium One Americas, Inc. |
| UIC | Underground Injection Control (pursuant to U.S. EPA regulations) |
| URE | Ur-Energy Inc. |
| URP | Uranium Recovery Program |
| U.S. | United States |
| USFWS | U.S. Fish and Wildlife Service |
| U3O8 | A standard chemical formula commonly used to express the natural form of uranium mineralization. U represents uranium and O represents oxygen. |
| 235U | Uranium isotope with an atomic mass of 235 |
| WDEQ | Wyoming Department of Environmental Quality WY Wyoming |
| WGFD | Wyoming Game and Fish Division |
| Ur-Energy – Lost Creek ISR Uranium Property Amended Technical Report Summary – September 19, 2022 | Page viii |
|
|
|
1.0 EXECUTIVE SUMMARY
This S-K 1300 Technical Report Summary (Report) for the Lost Creek Property (the Property) has been prepared for Ur-Energy Inc. (URE) and its subsidiaries, Lost Creek ISR, LLC (LC) and NFU Wyoming, LLC under the supervision of Western Water Consultants, Inc., d/b/a WWC Engineering (WWC), pursuant to Regulation S-K Subpart 1300, “Modernization of Property Disclosures for Mining Registrants” (S-K 1300). Its objective is to evaluate the technical and economic viability of the Property using the most current scientific, engineering and technical information. This Report covers resource calculations from drilling activities and production operations information through December 31, 2021.
The Lost Creek PROPERTY represents the composite of six individual contiguous PROJECTS:
|
| · | Lost Creek Project, |
|
| · | LC East Project, |
|
| · | LC West Project, |
|
| · | LC North Project, |
|
| · | LC South Project, and |
|
| · | EN Project |
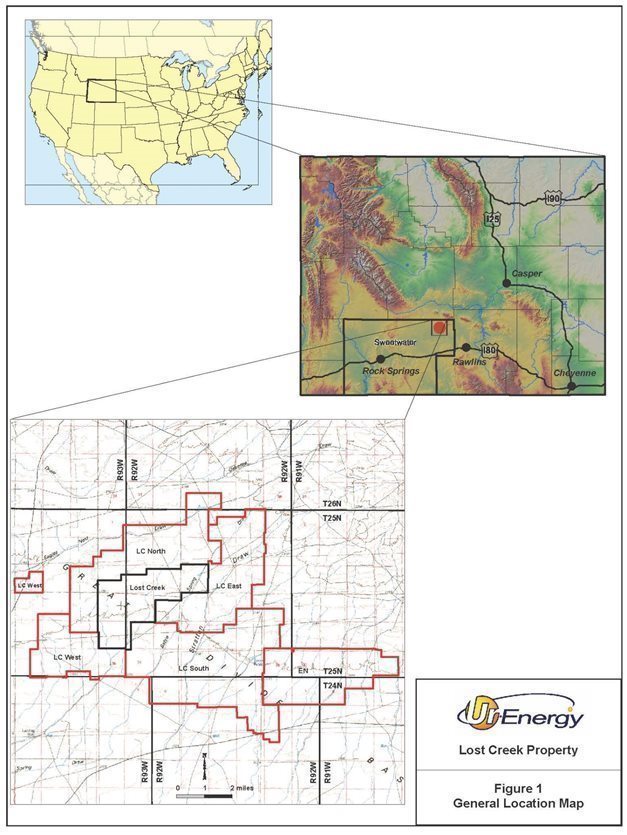
The licensed and operating Lost Creek Project is considered the core project while the others are collectively referred to as the Adjoining Projects. The Adjoining Projects were acquired by URE as exploration targets to provide resources supplemental to those recognized at the Lost Creek Project. Most were initially viewed as stand-alone projects but expanded over time such that collectively they now represent a contiguous land position and mineral property along with the Lost Creek Project. The Lost Creek Property is located in the northeast corner of Sweetwater County, approximately 90 miles southwest of Casper, Wyoming. Current total acreage is approximately 35,400 acres of federal mineral claims and state of Wyoming mineral leases (Figure 1).
The Property is situated in the northeastern part of the Great Divide Basin (GDB), which is underlain by up to 25,000 ft. of Paleozoic to Quaternary sedimentary units. Rock outcrops in the GDB are dominated by the Battle Spring Formation of Eocene age, which also hosts the uranium mineralization considered in this Report. The dominant lithology in the Battle Spring Formation is coarse arkosic sandstone, interbedded with intermittent mudstone, claystone and siltstone. Deposition occurred as alluvial-fluvial fan deposits within a south-southwest flowing paleo-drainage.
Exploration in the Lost Creek region started in the mid-1960s. Several companies explored portions of the current Property during this early period and continued to advance the uranium discoveries until 1983 when market conditions declined. New Frontiers Uranium, LLC acquired the Lost Creek Project in 2000 and held it until 2005 when Ur-Energy USA Inc. purchased 100 percent ownership of the property through the purchase of a wholly owned company, NFU Wyoming, LLC.
The uranium mineralization occurs as roll front type deposits formed where uranium precipitated from oxidizing groundwater when it contacted reduced host rock. The majority of known, potentially recoverable uranium throughout the Property occurs within two major mineralized trends. The Main Mineral Trend (MMT) lies within the Lost Creek Project and the East
| Ur-Energy – Lost Creek ISR Uranium Property Amended Technical Report Summary – September 19, 2022 | Page 1 |
|
|
|
| Ur-Energy – Lost Creek ISR Uranium Property Amended Technical Report Summary – September 19, 2022 | Page 2 |
|
|
|
Mineral Trend (EMT) occurs in the LC East Project. The main mineralized stratigraphic intervals are identified by URE as the HJ and KM Horizons of the Battle Spring Formation.
Additional uranium has been identified in the overlying FG and DE Horizons and also in the underlying Deep Horizons.
Construction of the Lost Creek plant and installation of Mine Unit 1 (MU1) was initiated in October 2012. Production operations in MU1 within the HJ Horizon began on August 2, 2013, and, through December 31, 2021, 2.735 million pounds of U3O8 have been produced from the originally planned 13 header houses (HHs) in MU1 and the first three planned HHs in Mine Unit 2 (MU2). For this Report, in order to accurately reflect existing resources, all resources produced through December 31, 2021, have been subtracted from total Measured resources from the HJ Horizon in MU1 and MU2. All the wells to support the originally planned 13 HHs for MU1 have been completed, and surface installations installed, as have the first three HHs in MU2. All monitor ring wells have been installed and pump tested in MU2. The Lost Creek Project is currently operating on a limited basis to maintain operational bleed in the wellfields due to depressed uranium prices. The processing plant and the wellfield remain in operable condition such that production can be quickly ramped up should prices improve.
The existing plant, wellfields, and disposal wells are all fully permitted with the appropriate authorities. Additionally, URE has received approval from the U.S. Bureau of Land Management (BLM) and Wyoming Department of Environmental Quality (WDEQ) Uranium Recovery Program (URP) for production in the HJ and KM Horizons within the LC East Project and to authorize production from additional HJ mine units within the EMT in the Lost Creek Project. Upon approval of an amendment of the Permit to Mine, URE will be able to pursue production in the KM and HJ Horizons at the LC East Project and additional HJ Units at the Lost Creek Project.
The mineral resource estimate for the Property is 11.914 million pounds in the Measured and Indicated categories, and 6.607 million pounds eU3O8 in the Inferred category. Lost Creek has produced 2.735 million pounds U3O8 as of December 31, 2021. The mineral resource reported here has been reduced to account for production to date. The resource estimate is summarized in Table 1.
The QP firm (QP), is of the opinion that the classification of the resources as stated meets the established professional standards and guidelines for reporting mineral resources for the purposes of S-K 1300. The mineral resource estimates in this Report, based on historical and URE drilling, were reviewed and accepted by the QP.
The majority of resources within the Property have been geographically allocated to 12 designated Resource Areas (RAs) which represent the accumulation of resources within a given horizon in a given area. Economic analyses in this Report are performed solely on these designated areas, due to the vertical and lateral continuity of the resources. RAs represent precursors to potential mine units (wellfields).
To date, RAs 1 and 2 have been converted to MU1 and MU2, respectively. At the current time, approximately 85 percent of the total Property resources, as presented in Table 1, are contained within RAs.
| Ur-Energy – Lost Creek ISR Uranium Property Amended Technical Report Summary – September 19, 2022 | Page 3 |
|
|
|
Table 1. Lost Creek Property – Resource Summary
|
| Measured | Indicated | Inferred | ||||||
| Project | Avg Grade % eU3O8 | Short Tons (X 1000) | Pounds (X 1000) | Avg Grade % eU3O8 | Short Tons (X 1000) | Pounds (X 1000) | Avg Grade % eU3O8 | Short Tons (X 1000) | Pounds (X 1000) |
| LOST CREEK | 0.048 | 8,572 | 8,173 | 0.048 | 3,412 | 3,295 | 0.046 | 3,261 | 3,013 |
| Production through 12/31/2021 |
0.048 |
-2,849 |
-2,735 |
|
|
|
|
|
|
| LC EAST | 0.052 | 1,392 | 1,449 | 0.041 | 1,891 | 1,567 | 0.042 | 2,954 | 2,484 |
| LC NORTH | — | — | — | — | — | — | 0.045 | 644 | 580 |
| LC SOUTH | — | — | — | 0.037 | 220 | 165 | 0.039 | 637 | 496 |
| LC WEST | — | — | — | — | — | — | 0.109 | 16 | 34 |
| EN | — | — | — | — | — | — | — | — | — |
| GRAND TOTAL | 0.048 | 7115 | 6,887 | 0.046 | 5,523 | 5,027 | 0.044 | 7,512 | 6,607 |
|
|
|
| MEASURED + INDICATED = | 12,638 | 11,914 |
|
|
| |
| 1. | Sum of Measured and Indicated tons and pounds may not add to the reported total due to rounding. |
| 2. | % eU3O8 is a measure of gamma intensity from a decay product of uranium and is not a direct measurement of uranium. Numerous comparisons of eU3O8 and chemical assays of Lost Creek rock samples, as well as PFN logging, indicate that eU3O8 is a reasonable indicator of the chemical concentration of uranium. |
| 3. | Table shows resources based on grade cutoff of 0.02 % eU3O8 and a grade x thickness cutoff of 0.20 GT. |
| 4. | Measured, Indicated, and Inferred Mineral Resources as defined in 17 CFR § 229.1300. |
| 5. | Resources are reported through December 31, 2021. |
| 6. | All reported resources occur below the static water table. |
| 7. | 2.735 million lbs. of U3O8 have been produced from the HJ Horizon in the Lost Creek Project as of December 31, 2021. |
| 8. | Mineral resources that are not mineral reserves do not have demonstrated economic viability. |
| 9. | The point of reference for resources is in situ at the Property. |
Cautionary statement: This Report is preliminary in nature and includes inferred mineral resources that are considered too speculative geologically to have the economic considerations applied to them that would enable them to be categorized as mineral reserves. Mineral resources that are not mineral reserves do not have demonstrated economic viability. There is increased risk and uncertainty to commencing and conducting production without established mineral reserves that may result in economic and technical failure which may adversely impact future profitability. The estimated mineral recovery used in this Report is based on recovery data from wellfield operations to date, as well as Ur-Energy personnel and industry experience at similar facilities. There can be no assurance that recovery at this level will be achieved.
The QP has assumed that URE’s operations at the Property will be conducted in conformance with applicable laws, regulations and requirements of federal, state and local agencies. It is also assumed that organization and management controls have been and will continue to be established to ensure compliance with applicable regulations and to implement URE’s policy for providing a safe working environment including the philosophy of maintaining radiation exposures As Low As Reasonably Achievable (ALARA).
| Ur-Energy – Lost Creek ISR Uranium Property Amended Technical Report Summary – September 19, 2022 | Page 4 |
|
|
|
The resources identified and evaluated have been added to the Lost Creek production plan and continue to support the possible economics of the Property. Using the estimated capital expenses (CAPEX), operating expenses (OPEX) and closure costs presented herein, a cash flow statement has been developed. The statement assumes no escalation, and no debt, interest or capital repayments. It also does not include depreciation. It should be noted that Lost Creek ISR, LLC is the recipient of a State of Wyoming Taxable Industrial Development Revenue Bond, as amended from time to time. Debt interest and repayment of this bond is not included in the economic analysis. This information is summarized in the following Table 2.
Table 2. Summary of Economics
| Economic Parameter |
| Units |
| Pre-income Tax |
|
| Post-income Tax |
| ||
| Initial CAPEX 1 |
| US$ 000s |
| $ | - |
|
| $ | - |
|
| Sustaining CAPEX |
| US$ 000s |
| $ | 19,878 |
|
| $ | 19,878 |
|
| LoM OPEX |
| $ / Lb |
| $ | 16.34 |
|
| $ | 16.34 |
|
| Income Taxes |
| $ / Lb |
| $ | - |
|
| $ | 8.72 |
|
| Total Cost per Pound |
| $ / Lb |
| $ | 33.61 |
|
| $ | 42.33 |
|
| Production |
| Lb 000s |
|
| 12,261 |
|
|
| 12,261 |
|
| Net Cash Flow |
| US$ 000s |
| $ | 376,427 |
|
| $ | 267,054 |
|
| NPV 8% |
| US$ 000s |
| $ | 210,894 |
|
| $ | 156,790 |
|
| IRR (adjusted for Undepreciated Initial Capital) 2 |
| % |
|
| 72.2 | % |
|
| 66.8 | % |
| 1. | Initial capital costs of $46.5 million were incurred and expended prior to the starting date of this economic analysis. Because there are no additional cash expenditures required for initial capital, they are therefore excluded from the cash flow and NPV calculations. |
| 2. | As of December 31, 2021, Lost Creek had $27.4 million of undepreciated, initial capital assets that will be charged against operations over time. By including the undepreciated, initial capital assets, an IRR can be calculated. Without these costs, an IRR cannot be calculated. |
The economic analyses presented herein provide the results of the analyses for pre-income tax and post-income tax, which includes U.S. federal and Illinois state income taxes. There is no State of Wyoming income tax, and all sales are assumed to take place in Illinois where the conversion facility is located. The only difference between the two scenarios is the value of the estimated income taxes. All other sales, property, use, severance and conservations taxes as well as royalties are included in both scenarios. Both economic analyses presented herein assume no escalation and no debt, interest or capital repayments. Ur-Energy USA Inc. files consolidated federal tax returns in the United States and had approximately $105.6 million in tax loss carry forwards as of December 31, 2021. URE does not anticipate paying any significant federal income taxes until the existing, and any future, tax loss carry forwards are utilized. In addition, reclamation costs can be deducted in the early years of the Property, thus also pushing out the tax liability.
The sale price for the produced uranium is assumed to vary based on an annual average of the projections prepared by VIII Capital Corp.; Cantor Fitzgerald Canada Corporation; H.C. Wainwright & Co.; and UxC, LLC (See Chapters 16 and 24). The revenue for the cash flow estimate was developed using the GT contour mineral resource estimate for the MMT and EMT, and further assumed that, based on an 80 percent recovery factor, approximately 12.3 million pounds of U3O8 will be recovered from the MMT and EMT at the Property.
| Ur-Energy – Lost Creek ISR Uranium Property Amended Technical Report Summary – September 19, 2022 | Page 5 |
|
|
|
Remaining CAPEX costs are for sustaining capital requirements at the mine site and are for the installation of a wastewater treatment building to optimize wastewater reduction. The remaining sustaining capital is for the replacement of equipment that will be used in future operations of the plant and the wellfields. The sustaining capital cost is estimated to be $19.9 million. In addition, costs are included in the wellfield development portion of this analysis for the installation of one additional Underground Injection Control (UIC) Class I deep disposal well (DDW) at an estimated cost of $3.2 million. The sustaining capital estimate is based on the actual previous purchases of the same equipment and/or vendor prices, thus the predicted level of accuracy of the sustaining capital estimate is +/- 10 percent. In cases where price quotes or previous purchases were made more than a year prior to this analysis, costs were escalated against the Consumer Price Index or the gross domestic product: implicit price deflator adjusted to December 2021 (CPI, 2021 & FRED, 2021)
URE purchased and paid for the processing plant and much of the first mine unit prior to the commencement of operations in 2013 and prior to this economic analysis. Those initial capital costs totaled approximately $46.5 million and are not included in this economic analysis because they were previously incurred.
OPEX cost estimates were developed by evaluating each process unit operation and associated operating services (power, water, air, waste disposal), infrastructure (offices, shops), salary plus burden, and environmental control (heat, air conditioning, monitoring). The OPEX estimate is based on URE’s current operating costs, budgets, development plan, deliverables, process flow sheets, process design, materials balance and project manpower schedule. The annual OPEX is provided in Chapter 18.0.
Construction of the plant and MU1 began in October 2012. Plant construction was completed in the third quarter of 2013. Wellfield drilling and construction activities have been completed to various levels with the majority of the work occurring in the MU1 and the areas of the first three HHs in MU2.
Subsequent to initial capital purchases, all other installation costs have been expensed. These include additional construction in MU1, installation of the monitor well ring in MU2 and drilling and construction of the third DDW. The Net Present Value (NPV) calculations assume that cash flows occur in the middle of the accounting periods. The NPV is calculated from the discounted cash flow model and is based on the CAPEX, OPEX and closure cost estimates, a variable future uranium price and the anticipated production schedule. Excluding sunk costs which occurred prior to December 31, 2021, the Property is estimated to generate net cash flow over its life, before income tax, of $376.4 million and $267.1 million after income tax. Payback of the initial capital investments, including $23.7 Million in sunk costs which occurred prior to the beginning of this analysis, is estimated during the second quarter of 2024. The Property has a calculated before tax Internal Rate of Return (IRR) of 72.2 percent and a before tax NPV of $210.9 million applying an eight percent discount rate. When income taxes are included in the calculation, the after-tax IRR is 66.8 percent and the after tax NPV is $156.8 million applying an eight percent discount rate. Life of Mine (LoM) operating costs are approximately $33.61 per pound of U3O8 produced including royalties and local taxes. Federal and State income taxes are estimated to be $8.72 per pound. A summary of the current project economics is presented below in Table 3 and is discussed in more detail in Chapter 19.
| Ur-Energy – Lost Creek ISR Uranium Property Amended Technical Report Summary – September 19, 2022 | Page 6 |
|
|
|
Approximately 27.4 percent of the resources in the economic analysis were inferred resources. Inferred resources are resources that are considered too speculative geologically to have modifying factors applied to them that would enable them to be categorized as mineral reserves, and there is no certainty that this economic assessment will be realized. To account for the chance that the inferred resources are not upgraded as mining progresses and URE collects additional drilling data, a second economic analysis was prepared which excluded the inferred resources. The estimated recovery excluding the inferred resources was 8.6 million pounds. Without the inferred resources the Property is estimated to generate net cash flow over its life, before income tax, of $234.8 million and $175.3 million after income tax. Without the inferred resources the calculated before tax IRR is 71.7 percent and a before tax NPV of $153.4 million applying an eight percent discount rate. When income taxes are included in the calculation without inferred resources, the after-tax IRR is 67.0 percent and the after tax NPV is $120.0 million applying an eight percent discount rate. Without the inferred resources LoM operating costs are estimated at approximately $36.23 per pound of U3O8 produced including royalties and local taxes. Income taxes are estimated to be $6.69 per pound.
Table 3. Cash Flow Summary
| Cash Flow Line Items |
| Units |
| Total |
|
| US$ per Pound |
| ||
| Pounds produced |
| Lbs |
|
| 12,261,347 |
|
|
|
| |
| Pounds sold |
| Lbs |
|
| 12,546,207 |
|
|
|
| |
| Sales |
| US$ 000s |
| $ | 798,601 |
|
| $ | 63.65 |
|
| Royalties |
| US$ 000s |
| $ | (440 | ) |
| $ | (0.04 | ) |
| Net sales |
| US$ 000s |
| $ | 798,161 |
|
| $ | 63.62 |
|
| Wyoming severance tax |
| US$ 000s |
| $ | (16,321 | ) |
| $ | (1.30 | ) |
| Sweetwater ad valorem tax |
| US$ 000s |
| $ | (27,598 | ) |
| $ | (2.20 | ) |
| Operating costs (see Table 9) |
| US$ 000s |
| $ | (205,055 | ) |
| $ | (16.34 | ) |
| Wellfield development |
| US$ 000s |
| $ | (151,733 | ) |
| $ | (12.09 | ) |
| Exploration cost |
| US$ 000s |
| $ | - |
|
| $ | - |
|
| Sweetwater property tax |
| US$ 000s |
| $ | (1,148 | ) |
| $ | (0.09 | ) |
| Working capital changes |
| US$ 000s |
| $ | - |
|
| $ | - |
|
| Project cash flow |
| US$ 000s |
| $ | 396,305 |
|
| $ | 31.59 |
|
| Initial capital |
| US$ 000s |
| $ | - |
|
| $ | - |
|
| Sustaining capital |
| US$ 000s |
| $ | (19,878 | ) |
| $ | (1.58 | ) |
| Net cash flow before tax |
| US$ 000s |
| $ | 376,427 |
|
| $ | 30.00 |
|
| Federal income tax |
| US$ 000s |
| $ | (77,108 | ) |
| $ | (6.15 | ) |
| State income tax |
| US$ 000s |
| $ | (32,265 | ) |
| $ | (2.57 | ) |
| Net cash flow after tax |
| US$ 000s |
| $ | 267,054 |
|
| $ | 21.29 |
|
| 1. | Production is based on an 80% recovery of the total of Measured, Indicated and Inferred resources in the 12 RAs of the MMT and EMT. |
| 2. | Uranium price is based on the average of the projections of VIII Capital Corp., November 4, 2021; Cantor Fitzgerald Canada Corporation, October 18, 2021; H.C. Wainwright & Co., September 29, 2021; and UxC, LLC, December 6, 2021, as discussed in Chapter 16.0. |
| 3. | Wellfield development includes wellfield drilling and wellfield construction costs. |
| 4. | Working capital changes are primarily related to annual cash flow timing differences in accounts receivable and accounts payable and totals to zero. |
| 5. | Pounds sold exceeds pounds produced due to existing inventories. |
| Ur-Energy – Lost Creek ISR Uranium Property Amended Technical Report Summary – September 19, 2022 | Page 7 |
|
|
|
The QP finds the Property is potentially viable based on the assumptions contained herein. There is no certainty that the mineral recovery or the economic analyses presented in this Report will be realized. In order to realize the full potential benefits described in this Report, the following activities, as discussed in Chapter 23.0 (Recommendations), are required:
|
| · | Further development of wellfields including MU2 and the resources not previously put under pattern in MU1, |
|
| · | Completion of the permit amendment process for the required permits and approvals for additional HJ production at Lost Creek and production from the HJ and KM Horizons at LC East production, |
|
| · | Continue to advance other adjoining projects as necessary to mine uranium at the Property, and |
|
| · | URE should continue with its pre-construction design and engineering work related to wastewater management processes and procedures with the goal of concentrating and minimizing RO brine production and maximizing permeate output. Further costs for this continued design and engineering work are estimated to be $0.2 million. |
| Ur-Energy – Lost Creek ISR Uranium Property Amended Technical Report Summary – September 19, 2022 | Page 8 |
|
|
|
2.0 INTRODUCTION
2.1 Registrant
WWC has been retained by URE to prepare this Report for the Property, which includes the Lost Creek Project and the Adjoining Projects located in northeastern Sweetwater County in south-central Wyoming, USA. This Report has been prepared in accordance with the guidelines set forth under S-K 1300 for the submission of technical reports on mineral properties. This Report also presents a validation of the estimate of Measured, Indicated and Inferred Mineral Resources as defined in S-K 1300 (17 CFR §229.1300). Estimates of Mineral Reserves were not prepared. Property economics and related analyses were also updated from earlier such analyses.
URE was incorporated on March 22, 2004 and is an exploration stage mining company engaged in the identification, acquisition, evaluation, exploration, development and operation of uranium properties in the United States. URE is incorporated in Canada with principal executive offices located at 10758 West Centennial Road, Suite 200, Littleton, CO 80127. URE’s uranium mineral property portfolio includes properties in the Great Divide Basin, the Shirley Basin, and the Gas Hills mining districts of Wyoming.
2.2 Terms of Reference
This Report was prepared to disclose the updated results of mineral resource estimations for the Property prompted by development activities through December 31, 2021. Property economics and related analyses were also updated from earlier such analyses. This is the first S-K 1300 technical report for the Property. However, reports meeting Canadian National Instrument 43-101 (NI 43-101) standards have been previously prepared and are referenced in this report. The last NI 43-101 compliant report prepared for the Property had a February 8, 2016, effective date (TREC, 2016).
2.3 Information Sources and References
The information and data presented in this Report was gathered from various sources listed in Chapters 24 and 25. Technical information was provided to WWC by URE and includes data from other professional consultants and follows generally accepted uranium ISR practices. Mineral resource estimates are based on exploration, delineation and production drilling, and associated data, provided by URE and reviewed by WWC.
The wellfield design was provided by URE with associated numbers and locations of wells and HHs. It includes the as-built design in MU1 and MU2 as well as anticipated wellfield layout for future development. The cost estimates presented here are based on wellfield layouts, process flow diagrams, tank and process equipment and buildings currently installed at the Property, personnel and capital equipment requirements provided by URE.
Units of measurement, unless otherwise indicated, are feet (ft.), miles, acres, pounds avoirdupois (lbs.), and short tons (2,000 lbs.). Uranium is expressed as pounds U3O8, the standard market unit. All references to dollars ($) are in U.S. dollars. Grades reported for historical resources and the mineral resources reported and used herein are percent eU3O8 (equivalent U3O8 by calibrated gamma geophysical logging unit). ISR refers to in situ recovery, sometimes also termed ISL or in situ leach. A complete list of abbreviations is provided on pages vii-viii.
| Ur-Energy – Lost Creek ISR Uranium Property Amended Technical Report Summary – September 19, 2022 | Page 9 |
|
|
|
2.4 Inspection of the Property by Each Qualified Person
WWC professionals have most recently visited the site on January 28, 2022, and on February 1, 2022. The purpose of these site visits was to observe the geography and geology of the Project site, verify work done at the site by URE, observe the potential locations of Project components, confirmation drilling and other site activities, and confirm existing site infrastructure including installed wellfields, plant facilities and equipment at the site.
2.4.1 QP Qualifications
Completion of this Report was under the direction and supervision of WWC. WWC is a third-party QP as defined by Regulation S-K 1300. Additionally, WWC has approved the technical disclosure contained in this Report.
2.5 Previous Technical Report Summaries
URE has not previously filed a Technical Report Summary under S-K 1300 regulations. Additional reports meeting Canadian National Instrument 43-101 (NI 43-101) standards have been previously prepared and are referenced in this report.
| Ur-Energy – Lost Creek ISR Uranium Property Amended Technical Report Summary – September 19, 2022 | Page 10 |
|
|
|
3.0 PROPERTY DESCRIPTION AND LOCATION
3.1 Location and Size
The Property is located in the northeastern corner of Sweetwater County in south-central Wyoming. As shown on Figure 1, the Property is in an unpopulated area located approximately 15 miles southwest of Bairoil, Wyoming, about 38 miles northwest of Rawlins, Wyoming and about 90 miles southwest of Casper, Wyoming. It is centered at approximately 42 degrees, 8.06 minutes North latitude and 107 degrees, 51.7 minutes West longitude. All references herein to Township and Range occur within the 6th Prime Meridian.
The Lost Creek plant is constructed and operating. Production well installation for the originally designed 13 HHs in MU1 is complete and production operations have occurred in all 13. Additionally, the first three HHs of MU2 have been constructed and are operational. Additional HHs will be developed in both mine units and additional recovery areas, as production requirements warrant. Three DDWs were drilled and operated; subsequently, one deep well was plugged and abandoned. Shallow UIC Class V wells for water recycling were permitted, drilled and have been in operation since 2017. Associated access roads have been constructed. URE has also installed numerous monitoring and other wells in support of its permit and license applications and to further mine planning. Various other infrastructure, including wells, water tanks, ponds, a meteorological station, and other equipment, has been placed on the Property by URE in support of its mining, development, exploration, and permit/license activities.
The Property currently comprises six individual Projects named the Lost Creek, LC East, LC North, LC South, LC West, and EN Projects (Figure 2) located over approximately 35,400 acres. The Lost Creek Project is considered the core project, with current production occurring in MU1 and MU2. The other five Projects, collectively referred to as the Adjoining Projects, are extension and exploration properties targeted as possible sources of additional feed to the Lost Creek Project production facilities. All Projects within the Property consist mostly or entirely of federal unpatented lode mining claims. Three of the Projects also have state mineral leases. URE does not hold any private (fee) mineral leases within the Property. Land holdings within the six Projects of the Property are summarized below. With the exception of the Lost Creek Project, acreage estimates are rounded to the nearest 10s.
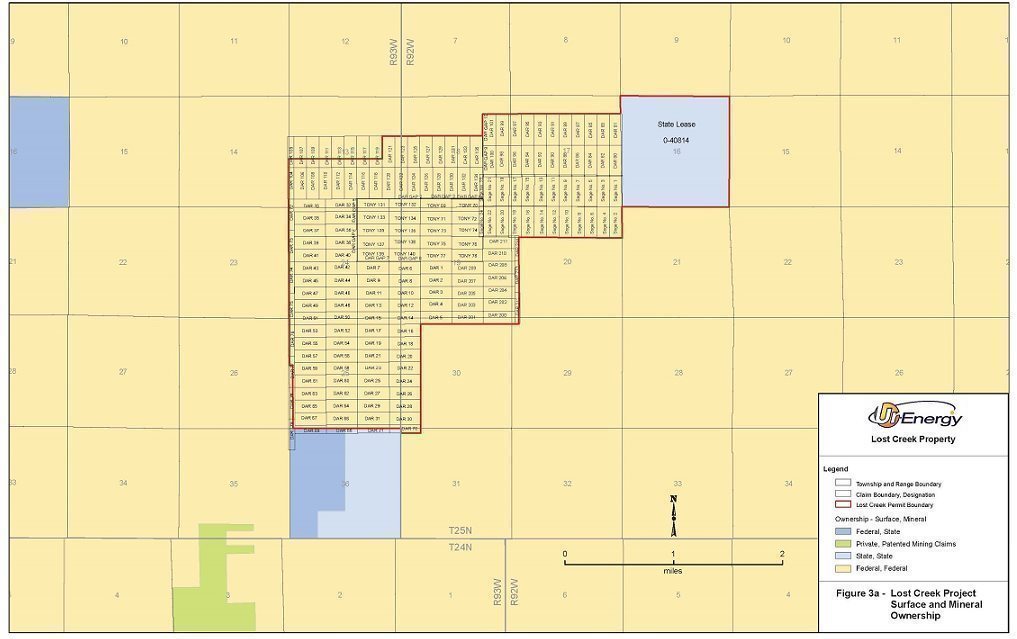
Lost Creek Project: is located in Sections 13, 24 and 25 of T25N, R93W, and Sections 16 through 20 and 29 through 31 of T25N, R92W (Figure 3a). The Project is approximately 4,194 acres in size, including 3,554 acres in 201 federal unpatented lode mining claims and 640 acres in one state of Wyoming mineral lease.
Adjoining Company Projects:
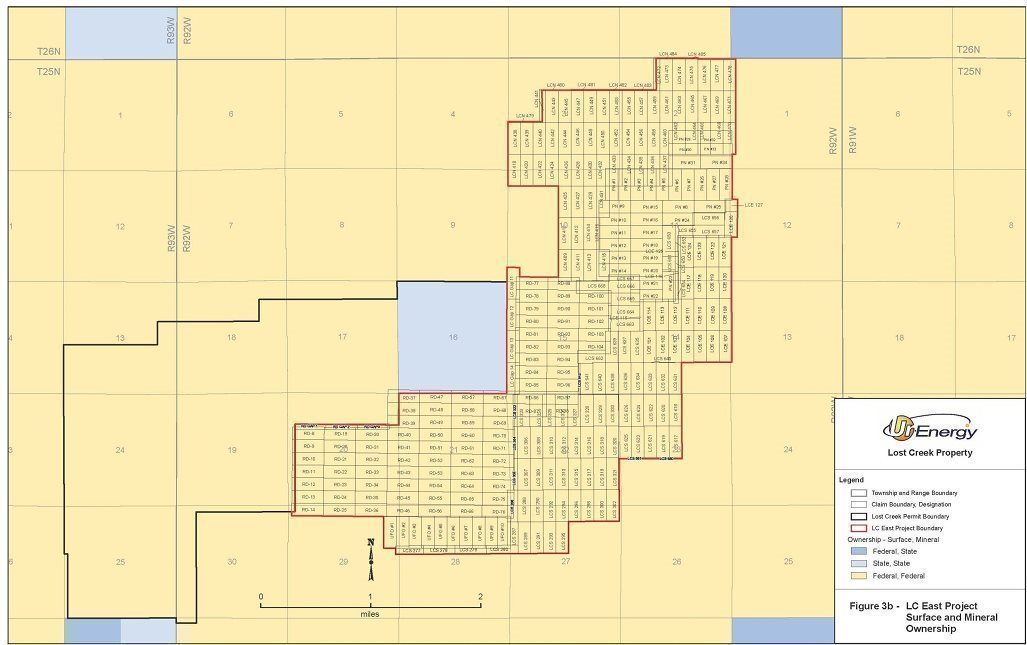
LC East Project: is a block of 324 federal mineral claims (Figure 3b) which are adjoining to the east and northeast of the Lost Creek Project, within Sections 1 through 3, 10 through 15, 20 through 23, 27 through 29 of T25N, R92W. The LC East Project encompasses approximately 5,750 acres.
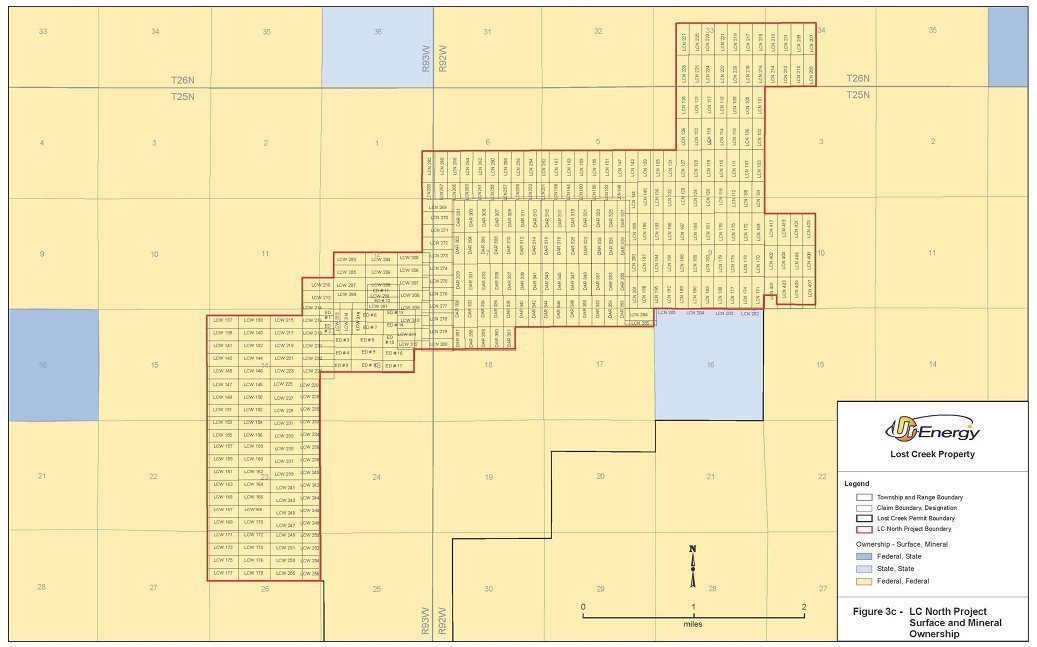
LC North Project: is adjoining to the north and west of the Lost Creek Project in Sections 4 through 10, 17, and 18 of T25N, R92W, Sections 1, 11 through 15, 22, 23, 26, and 27 of T25N, R93W and Sections 33 through 34 of T26N, R92W (Figure 3c). The LC North Project includes 338 federal unpatented lode mining claims totaling approximately 6,260 acres.
| Ur-Energy – Lost Creek ISR Uranium Property Amended Technical Report Summary – September 19, 2022 | Page 11 |
|
|
|

| Ur-Energy – Lost Creek ISR Uranium Property Amended Technical Report Summary – September 19, 2022 | Page 12 |
|
|
|
| Ur-Energy – Lost Creek ISR Uranium Property Amended Technical Report Summary – September 19, 2022 | Page 13 |
|
|
|
| Ur-Energy – Lost Creek ISR Uranium Property Amended Technical Report Summary – September 19, 2022 | Page 14 |
|
|
|
| Ur-Energy – Lost Creek ISR Uranium Property Amended Technical Report Summary – September 19, 2022 | Page 15 |
|
|
|
LC South Project: is an adjoining project to the south and east of the Lost Creek Project in Sections 22 through 35 of T25N, R92W, Sections 3 through 6, and 8 through 11, 14, and 15 of T24N, R92W, and Section 1 of T24N, R93W (Figure 3d). The LC South Project encompasses 546 federal unpatented lode mining claims totaling approximately 10,200 acres.
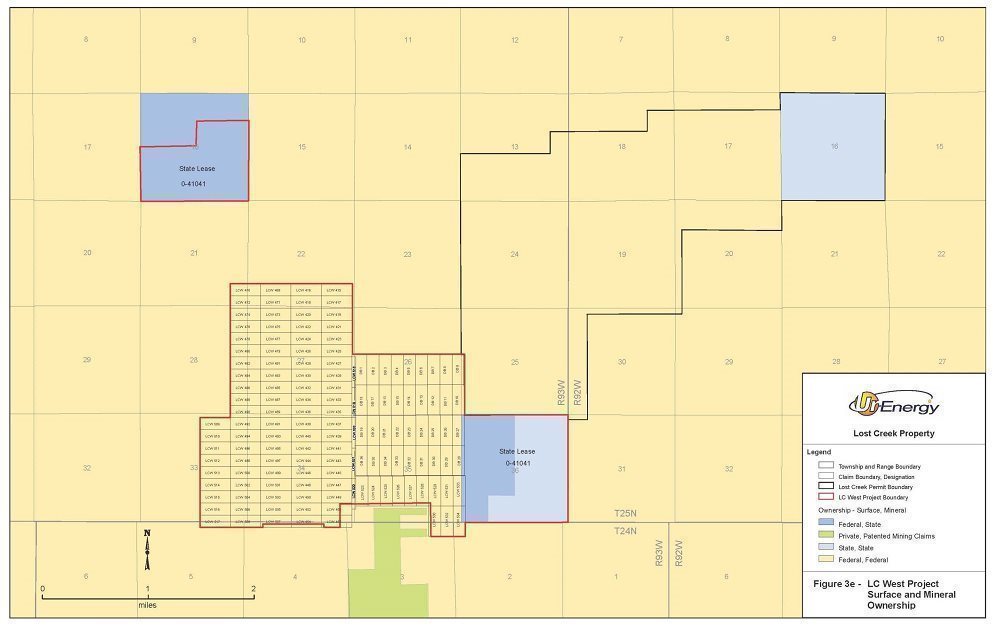
LC West Project: consists of a block of mining claims plus one state lease in two parcels (Figure 3e). Most of LC West adjoins the Lost Creek, LC North and LC South Projects within Sections 16, 21, 22, 25 through 28, 33 through 36 of T25N, R93W, and Sections 2 through 5 of T24N, R93W. One of the state mineral lease parcels lies as a disconnected parcel approximately a mile north from the LC West mining claims. LC West Project encompasses a total of approximately 3,840 acres, including 2,800 acres in 142 federal unpatented lode mining claims and 1,040 acres in the state of Wyoming mineral lease.
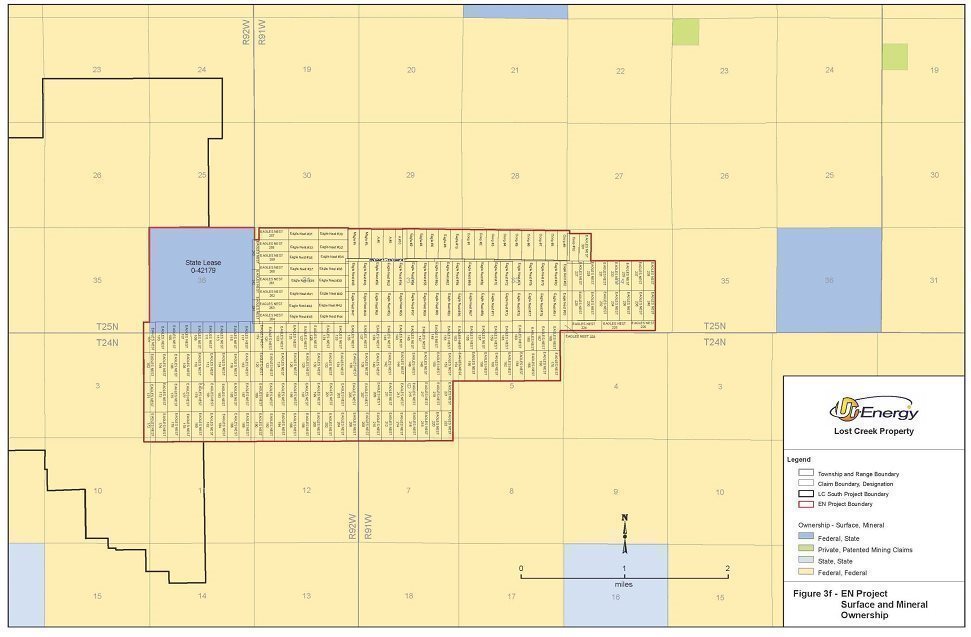
EN Project: is the adjoining project to the east of the LC South Project in Sections 31 through 34 of T25N, R91W, Sections 5 through 7 of T24N, R91W, Sections 35 and 36 of T25N, R92W, and Sections 1 through 3 and 10 through 12 of T24N, R92W (Figure 3f). The current EN Project encompasses approximately 5,160 acres, including approximately 4,520 acres in 234 federal unpatented lode mining claims and 640 acres in the state of Wyoming mineral lease.
3.2 Mining Claims, Mineral Leases and Surface Use Agreements
Collectively the Property currently consists of a total of 1,785 federal unpatented lode mining claims and three state of Wyoming leases for uranium and associated minerals. The land status of each project is illustrated in Figures 3a-f and described below:
The surface of all the mining claims is controlled by the BLM, with URE possessing the right to use as much of the surface as is necessary for exploration and mining of the claims, subject to compliance with all federal, state and local laws and regulations. Surface use on BLM lands is administered under federal regulations.
The Lost Creek and other projects currently held by LC are subject to a mortgage securing a bond loan with Sweetwater County, Wyoming, through the State of Wyoming Taxable Industrial Development Revenue Bond program, and the related State bond which was issued for this loan in October 2013. The mortgage, as amended, is recorded in Sweetwater County, Wyoming (October 23, 2013, Rec. 1630230 Bk. 1202, pg. 5867; December 28, 2015, Rec. 1646033 Bk. 1212, pg. 4611); October 1, 2019, Rec. 1669974, Bk. 1228, pg. 5759; and October 7, 2020, Rec. 1677345, Bk. 1235, Pg. 976).
| Ur-Energy – Lost Creek ISR Uranium Property Amended Technical Report Summary – September 19, 2022 | Page 16 |
|
|
|

| Ur-Energy – Lost Creek ISR Uranium Property Amended Technical Report Summary – September 19, 2022 | Page 17 |
|
|
|
| Ur-Energy – Lost Creek ISR Uranium Property Amended Technical Report Summary – September 19, 2022 | Page 18 |
|
|
|
| Ur-Energy – Lost Creek ISR Uranium Property Amended Technical Report Summary – September 19, 2022 | Page 19 |
|
|
|
Similarly, access to state-controlled land is largely inherent within the state of Wyoming mineral leases. The state lease within the Lost Creek Project requires a nominal surface impact fee to be paid as may the other state mineral leases from time to time. Various Temporary Use Permits are in place at the Property, including one which allows for the use and maintenance of an improved road on the leased state section within the Lost Creek Project.
3.3 Title to Property
URE, through its wholly owned subsidiaries Lost Creek ISR, LLC and NFU Wyoming, LLC controls the federal unpatented lode mining claims and state of Wyoming mineral leases which comprise the Property. Currently, NFU Wyoming, LLC controls the mining claims and state lease at the EN Project. Lost Creek ISR, LLC controls the lands at the other five projects within the Property, including Lost Creek Project. Title to the mining claims is subject to rights of pedis possessio against all third-party claimants as long as the claims are maintained. The mining claims do not have an expiration date. Affidavits have been timely filed with the BLM and recorded with the Sweetwater County Recorder attesting to the payment of annual maintenance fees to the BLM as established by law. The state leases have a ten-year term, subject to renewal for successive ten-year terms. From time to time, formal mineral title reports are prepared for URE by mineral title attorneys.
3.3.1 Property Boundaries
A professional legal survey of the permit area boundary of the Lost Creek Project was completed in advance of the submission of applications for permits and licenses on the Project. Similarly, a professional legal survey was conducted for the permit area for the LC East Project permit amendments. Legal surveys of individual mining claims are not required, and otherwise have not been completed. The area covered by the state leases is based on the legal subdivision descriptions as set forth by the U.S. Cadastral Survey and has not been verified by legal surveys.
3.4 Royalties, Taxes and Fees
URE is required to pay various state and local taxes related to production and the ownership of property. These taxes are in the form of severance, ad valorem, gross products, personal, and real property taxes. There is no state income tax in Wyoming. Royalties based on sales of uranium will be paid to the state under the state mineral lease at the Project. The state mineral leases carry the standard five percent royalty required by law. There are no royalties owed on the mining claims held at the Lost Creek Project. Various royalties exist on portions of the Adjoining Projects, including on a portion of LC East Project. Those royalties, as they pertain to currently anticipated production, have been included in the analysis but are relatively insignificant affecting only three future HHs at a rate of one percent of production sales. Additionally, maintenance fees will be paid to the BLM, and payments made to the state for the state mineral leases. Currently, annual maintenance fees to the BLM are $165/claim with a nominal recording fee paid to Sweetwater County (i.e., <$200, annually). Annual payments of the three state mineral leases in the Property are currently $3.00/acre (Lost Creek lease, $1,920; EN lease, $1,920; LC West lease, $3,120).
| Ur-Energy – Lost Creek ISR Uranium Property Amended Technical Report Summary – September 19, 2022 | Page 20 |
|
|
|
The Property economic analysis includes tax estimates for state severance taxes, county ad valorem taxes and property taxes, all of which are directly attributable to the Property. The economic analyses presented herein also provide the results of the analyses for pre-income tax and post-income tax, which includes U.S. federal and Illinois state income taxes. There is no State of Wyoming income tax, and all sales are assumed to take place in Illinois where the conversion facility is located. The only difference between the two scenarios is the value of the estimated income taxes. All other sales, property, use, severance and conservations taxes as well as royalties are included in both scenarios. Both economic analyses presented herein assume no escalation and no debt, interest or capital repayments. Ur-Energy USA Inc. files consolidated federal tax returns in the United States and had approximately $105.6 million in tax loss carry forwards as of December 31, 2021. URE does not anticipate paying any significant federal income taxes until the existing, and any future, tax loss carry forwards are utilized. In addition, reclamation costs can be deducted in the early years of the project, thus also pushing out the tax liability.
3.5 Significant Encumbrances or Risks to Perform Work on the Property
3.5.1 Environmental Liabilities
There were no pre-existing mineral processing facilities or related tailings ponds or waste deposits within the Property prior to the initiation of the construction of Lost Creek’s ISR facilities and wellfields. Surface disturbance included in the economic analysis is associated with drilling, well installation, wellfield construction, plant construction and installation of the three deep waste disposal wells. Likewise, subsurface disturbance is associated with the injection and production operations in MU1 and MU2. Other than the foregoing, there are no known environmental liabilities on the Property. The total bond held by the WDEQ to reclaim property disturbances for which LC is liable is $16.844 million as of December 31, 2021.
3.5.2 Existing and Required Permits
All permits and authorizations required to operate the Lost Creek Mine, as currently operating, are in place and include the following:
|
| · | The BLM issued a Record of Decision on the Lost Creek Plan of Operations in October 2012. |
|
|
|
|
|
| · | The BLM issued a Record of Decision on the LC East and KM Amendment in March 2019. |
|
|
|
|
|
| · | The U.S. Nuclear Regulatory Commission (NRC) issued a Source and Byproduct Material License SUA-1598 in August 2011. The NRC subsequently performed pre-operational inspections and granted permission to begin mining on August 2, 2013, and permission to operate the yellowcake dryer on October 3, 2013. |
|
|
|
|
|
| · | The URP issued Source and Byproduct Material License WYSUA-1598 Amendment No. 8 in August 2021. |
|
|
|
|
|
| · | In addition to the URP license for LC East, WDEQ has issued several permits including: |
|
| o | Permit 788, which includes an aquifer exemption for the three Lost Creek HJ mine units and approval to begin injection in MU1, was granted in October 2011. A hydrologic package must be submitted for review and approval for each subsequent Mine Unit. Approval of the MU2 hydrologic package was granted in 2017. |
|
|
|
|
|
| o | Permit 788 was granted after consultation with the Wyoming Game and Fish Department (WGFD) and the U.S. Fish and Wildlife Service (USFWS). Special consideration was given to greater sage grouse protection. |
|
|
|
|
|
| o | Air Quality Permit CGT-13201 was issued in May 2012. In March 2021, the WDEQ-Air Quality Division (AQD) issued a determination that a further permit for LC East was not required. |
| Ur-Energy – Lost Creek ISR Uranium Property Amended Technical Report Summary – September 19, 2022 | Page 21 |
|
|
|
|
| o | Storm Water Discharge Permit WYR103695 was approved in June 2011 and includes the LC East and Lost Creek Projects. |
|
|
|
|
|
| o | Class I UIC Permit 09-586, granting permission to install up to five DDWs, was granted in May 2010. An aquifer exemption for LC DW #4 was subsequently granted in December 2013. The U.S. Environmental Protection Agency (EPA) granted an aquifer exemption for LC DW#3 in October 2014. Additional aquifer exemptions may be required if other deep wells are drilled and encounter water quality less than 10,000 mg/l total dissolved solids. An aquifer exemption was not required for LC DW #1 since the water contains greater than 10,000 mg/l total dissolved solids. |
|
|
|
|
|
| o | Class V UIC Permit 15-081, granting permission to operate two injection wells was issued in June 2016. |
|
| · | The two facility holding ponds were approved by EPA Permit 8P-AR in December 2011 and by State Engineer Permit 13595R in May 2010. |
|
|
|
|
|
| · | Sweetwater County rezoned the land per Resolution 08-03-ZO-07 in March 2008. The county later approved the Development Plan in December 2009. Septic Permit 11‑082 was issued in April 2011. The county has also signed a Road Maintenance Agreement allowing the company to remove snow from local county roads as needed. |
|
|
|
|
|
| · | Sweetwater County rezoned the land for LC East per Resolution 21-05-ZO-01 in May 2021. No further approval is required with respect to a development plan. |
|
|
|
|
|
| · | Numerous well installation permits have been applied for and received through the State Engineer’s Office. Additional permits will be sought as needed. |
|
|
|
|
|
| · | Exploration activities on the Adjoining Projects are carried out under Drill Notices issued by the WDEQ and Notices of Operations issued by the BLM. These permits are obtained and managed as necessary to continue exploration work. |
The following permits will be required before beginning recovery at LC East and within the additional HJ Horizon Mine Units at Lost Creek.
|
| · | Approval from WDEQ LQD for the major modification to Permit 788 to allow mining in the KM and HJ Horizons at LC East. The approval will include an aquifer exemption for both horizons. |
|
|
|
|
|
| · | Approval from WDEQ-LQD for the major modification to Permit 788 to allow mining in additional HJ Mine Units at Lost Creek. The approval will include an aquifer exemption for additional HJ Horizons. |
|
|
|
|
|
| · | Block permits for UIC Class III wells will be submitted to the State Engineer’s Office closer to the time of production operations. |
3.5.3 Significant Risks that May affect Access, Title, or Right to Perform Work
The Lost Creek plant has been constructed and is operational. Production well installation in MU1 is complete for all 13 originally designed HHs and the first three planned HHs in MU2. HHs 1-1 through 1-13 and HHs 2-1 through 2-3 were operational prior to the reduction in operations. The plant is currently operating at a limited capacity to maintain required wellfield bleed. The reduction in operations is due to depressed uranium prices. The plant remains fully operational to take advantage of improving prices in the future. Three DDWs were drilled at the Property, of which one has been plugged and abandoned; the other two deep wells remain operational. Two UIC Class V wells were installed and are operational. The plant and associated access roads have been constructed. URE has also installed numerous monitoring and other wells in support of its permit and license applications and to further its mine planning. Various other infrastructure, including wells, water tanks, a meteorological station, and other equipment, has been placed on the Property by URE in support of its mining, development, exploration, and permit/license activities.
The QP is aware of no significant factors that contribute to operational risks for the Property.
| Ur-Energy – Lost Creek ISR Uranium Property Amended Technical Report Summary – September 19, 2022 | Page 22 |
|
|
|
4.0 ACCESSIBILITY, CLIMATE, LOCAL RESOURCES, INFRASTRUCTURE AND PHYSIOGRAPHY
4.1 Physiography
The Property is located near the northeastern part of the Great Divide Basin (GDB) and occurs at an elevation of approximately 7,000 ft. above mean sea level. The GDB is an oval-shaped structural depression encompassing some 3,500 square miles in south-central Wyoming. The GDB is bounded on the north by the Wind River Range and Granite Mountains, on the east by the Rawlins Uplift, on the south by the Wamsutter Arch, and on the west by the Rock Springs Uplift.
Most of the Property consists of flat upland areas and gentle south facing slopes that are dissected by southerly-flowing ephemeral washes. There are no perennial streams on the Property. The vegetation on the Property is dominated by sagebrush (Artemisia tridentata) which occurs throughout both upland and lowland environmental settings. Sagebrush is well adapted to the cold winter temperatures and limited precipitation that characterize the Property. Other vegetation identified at the Property includes native cool season perennial grasses, perennial forbs, cushion plants, semi-shrubs, cacti, shrubs and lichens.
4.2 Means of Access
Regional access to the Property relies almost exclusively on existing public roads and highways. The local and regional transportation network relevant to the Property consists of primary, secondary, local and unimproved roads (Figures 1 and 2). Direct access to the Property relies mainly on two crown-and-ditched gravel paved access roads to the processing plant. One enters from the west off Sweetwater County Road 23N (Wamsutter-Crooks Gap Road). The other enters from the east off of BLM Sooner Road. In addition to the designated routes, there are a number of four-wheel-drive “two-track” roads that traverse the area for recreation and grazing access, as well as various other uses, including uranium exploration. On a wider basis, from population centers, the Property area is served by an Interstate Highway (Interstate 80), a U.S. Highway (US 287), Wyoming state routes (SR 220 and 73 to Bairoil), local county roads, and BLM roads.
4.3 Proximity to Population Centers
The Property is located in a remote area of south-central Wyoming. The nearest town, Bairoil, with a population of less than 100, is about 17 miles northeast of the Lost Creek plant. The Wyoming towns of Rawlins, Rock Springs and Casper are approximately 36, 82 and 90 miles from the Property, respectively. Figures 1 and 2 show the locations of population centers with respect to the Property.
Sweetwater County, in which the Property is located, had a population of 42,272 in 2020. This represents a 3.5 percent decrease in Sweetwater County’s population since the 2010 census (U.S. Census Bureau 2020 Report on Sweetwater County, WY). Sweetwater County has a population density of 4.2 people per square mile. Carbon County, which is south of the Property, had a population of 14,537 in 2020 which was primarily located in the town of Rawlins. This represents an 8.5 percent decrease in Carbon County’s population since the 2010 census (U.S. Census Bureau 2020 Report on Carbon County, WY).
Personnel required for management, construction, development, and operation of the Property are drawn from Rawlins, Bairoil, Jeffrey City, Lander, Riverton, Rock Springs and Casper, Wyoming.
| Ur-Energy – Lost Creek ISR Uranium Property Amended Technical Report Summary – September 19, 2022 | Page 23 |
|
|
|
4.4 Climate and Operating Season
The Property is located in the intermountain semi-desert eco-region (Curtis and Grimes, 2004), which has cold winters and short, hot summers (Bailey, 1995). The average annual temperatures range from 40 to 52 degrees Fahrenheit. The average annual precipitation ranges from five to 14 inches (Bailey, 1995). Winter weather may limit the time periods for certain portions of wellfield drilling and construction at the Property but to date has not significantly affected operation of the ISR facility. ISR operations at the Property are conducted year-round.
The state of Wyoming has developed a Core Area Strategy to help protect the greater sage-grouse species within certain core areas of Wyoming. Exploration areas of the Property are all within the Greater South Pass core area and are thus subject to work activity restrictions from March 1 to July 15 of each year. The timing restriction precludes exploration drilling and other non-operational based activities that may disturb the greater sage-grouse. Drilling activity is not restricted outside this period.
The greater sage-grouse timing restrictions relevant to ISR production activities at the Lost Creek Project are somewhat different because the state of Wyoming has recognized that mines within core areas must be allowed to operate year-round. Therefore, since construction at the Lost Creek Project began, there have been no timing restrictions on drilling, construction, or operational activities within pre-approved disturbed areas as shown in the Permit to Mine. These disturbed areas include the processing plant, holding ponds, roads, power lines, wellfields, and DDWs. Any exploration drilling within the Property but outside the pre-defined disturbed area of the Permit to Mine will continue to be subject to greater sage-grouse timing restrictions.
The Core Area Strategy also places limitations on the amount of disturbance within an area. Planned disturbance is limited and therefore is unlikely to result in limitations on exploration drilling. For the Property, there is a five percent cap on anthropogenic disturbance in the area. Analyses of the planned disturbance on the Property, including those areas which are permitted, or for which permits will be sought, will be conducted to be consistent with the Wyoming regulatory scheme, and also will be reviewed on a time-to-time basis by WGFD. The WGFD has also approved the Lost Creek Sage Grouse Protection Plan for the Lost Creek Project.
4.5 Property Infrastructure
The Property currently contains an operational ISR processing plant, wellfields, water disposal infrastructure, and necessary equipment to support ISR operations. The basic infrastructure (power, water, and transportation) necessary to support an ISR mining operation is located within reasonable proximity of the Property. Generally, the proximity of the Property to paved roads is beneficial with respect to transportation of equipment, supplies, personnel and product to and from the Property. Improved gravel surfaced access roads have been constructed to the Property from adjacent county roads. Existing regional overhead electrical service is aligned in a north-to-south direction along the western boundary of the Lost Creek Project. An overhead raptor resistant power line, approximately two miles in length, was constructed in 2012 to bring power from the existing Pacific Power line to the Lost Creek plant. Power drops have been made to the Project and distributed to the plant, offices, wellfields, and other facilities.
| Ur-Energy – Lost Creek ISR Uranium Property Amended Technical Report Summary – September 19, 2022 | Page 24 |
|
|
|
Previous infrastructure near the Property is predominantly related to oil and gas development, past and present uranium exploration and beneficiation, and recreation. There have been several historical conventional uranium mills and mines and one historical ISR project (Bison Basin Project) in the vicinity of the Property (Figure 2). The closest mining facility to the Property is the Sweetwater Mine and Mill, a conventional uranium mine and mill that is not currently operational. The facility lies about three and one-half miles south of the southwestern-most boundary of URE’s Lost Creek Project, with less than one mile separating the respective property boundaries.
Lost Creek operations require disposal into DDWs of limited quantities of fluids that cannot be returned to the production aquifers. Five DDWs are permitted for the Lost Creek Project, of which three have been drilled to date, and two remain operational after one DDW was plugged and abandoned. Three additional deep wells are proposed for LC East. Two UIC Class V injection wells have been completed and have been in operation since 2017 as a part of the water recycling systems. Two storage ponds, permitted by state and federal regulators, are located adjacent to the plant and are used to temporarily store the water that will ultimately be disposed of in the DDWs.
The first DDW (LC DW #1) was installed in 2008 and is located in the extreme southwest corner of the Lost Creek Project. The second DDW (LC DW #4) was drilled in 2012 immediately south of the plant building. A third DDW (LC DW #3) was drilled and installed in the SW quarter of Section 13, T25N, R92W in 2014. The location of the other planned DDW for Lost Creek is the SE quarter of Section 17, T25N, R92W. An additional permitted option is in the SE quarter of Section 19, T25N, R92W.
Three additional DDWs proposed by the amendments for LC East would be located in T25N, R92W in the SW quarter of Section 22, NW quarter of Section 23 and the SE quarter of Section 10. For a further discussion of the wastewater disposal and related infrastructure, see Chapter 14.3 (Liquid Disposal). Ponds, outdoor tank storage, and the Class V disposal wells are located proximate to the plant and office building location (see Figures 2 and 12).
Tailings storage areas, solid waste disposal areas, and heap leach pad(s) will not be a part of the infrastructure for the Property as ISR operations do not require these types of facilities.
4.5.1 Water Supply
Most of the non-potable water for ISR operations is obtained from the mining operation, i.e., from extracted groundwater. With the exception of a 0.5 percent to 1.5 percent bleed, the groundwater extracted by the production wells will continue to be recycled through the system.
Water for activities within the Property is currently supplied by 12 water wells drilled by URE. Eight of these are located within the Lost Creek Project, one is in the LC North Project, one is in the LC South Project, and one is in the EN Project. All but one of the active wells produces water in excess of 25 gallons per minute. Water usage in the past has been mostly for drilling, casing wells, and abandonment of exploration and delineation holes. Two of the eight wells in the Lost Creek Project are adjacent to the plant site. One of those is being used as a source of fire suppression water and the other as a source of fresh water. Additional wells may be necessary as exploration and production activities extend further from the plant.
| Ur-Energy – Lost Creek ISR Uranium Property Amended Technical Report Summary – September 19, 2022 | Page 25 |
|
|
|
5.0 HISTORY
Uranium was discovered in the GDB in 1936. Exploration activity increased in the early 1950s after the Gas Hills District discoveries, and continued to increase in the 1960s, with the discovery of numerous additional occurrences of uranium. Wolf Land and Exploration (a private corporation which later became publicly traded as Inexco), Climax (Amax) and Conoco Minerals were the earliest operators in the area of what is now the Property and made the initial discoveries of low-grade uranium mineralization in the Battle Spring Formation in 1968.
Conoco entered into a joint venture with Inexco in 1969. Conoco gained sole control of the properties in 1970 and continued to explore their large land position in the region as what they called “Project A”. In doing so, they identified the eastern half of what is now referred to as the MMT in the Lost Creek Project and also what is known as the EMT in the LC East Project. Conoco’s “Project A” also included large portions of what are now the LC North, LC South and EN Projects.
Kerr-McGee, Humble Oil (Exxon), and Valley Development, Inc. were also active early in the region.
5.1 Ownership History
5.1.1 Ownership History of Lost Creek Project
Inexco, Conoco, Climax and Valley Development, Inc. obtained the initial land positions in the Lost Creek Project area in the late 1960s. Conoco took over Inexco’s land position in 1970.
Texasgulf entered the area in 1976 by acquiring the western half of what is now the Lost Creek Project through a joint venture with Climax. Also in 1976, Texasgulf entered into a joint venture with Valley Development, Inc. and initiated a major exploration program that resulted in the identification of the western half of the MMT. In 1978, Texasgulf joined with Conoco as operator in a joint venture to continue exploring the MMT. Texasgulf acquired a 100 percent interest in Valley Development, Inc. property in 1979 and continued with extensive exploration efforts and, by the early 1980s, had fully identified the MMT. They subsequently dropped the property in 1983 due to the declining uranium market.
The property was subsequently acquired by Cherokee Exploration, Inc., which conducted no field activities. In 1987, Power Nuclear Corporation (also known as PNC Exploration) acquired 100 percent interest in the project from Cherokee Exploration, Inc. PNC Exploration carried out a limited exploration program as well as geologic investigations and an evaluation of previous in situ leach testing by Texasgulf.
In 2000, New Frontiers Uranium, LLC acquired the property and related database from PNC Exploration but conducted no drilling or geologic studies. New Frontiers Uranium, LLC later transferred the Lost Creek Project-area property, along with its other Wyoming properties, to NFU Wyoming, LLC.
In 2005, Ur-Energy USA Inc., a wholly owned subsidiary of URE, purchased 100 percent ownership of NFU Wyoming, LLC. Within the first year of ownership, URE initiated drilling, and preparations for mining permit applications. Toward that goal, it conducted engineering studies, core drilling for metallurgical studies, and delineation drilling to outline and define the uranium resources. In addition, comprehensive baseline studies were initiated, including installation of additional monitor wells for hydrological testing and water-quality sampling and a meteorological station within the Property area. Figure 3a shows the current Lost Creek Project boundary and claims.
| Ur-Energy – Lost Creek ISR Uranium Property Amended Technical Report Summary – September 19, 2022 | Page 26 |
|
|
|
In 2007, NFU Wyoming, LLC transferred the Lost Creek Project to Lost Creek ISR, LLC, a wholly owned subsidiary of Ur-Energy USA Inc. formed for the purpose of owning and developing the Project through the permitting process and into operations as an ISR mine. In 2012 the LC East Project was transferred into Lost Creek ISR, LLC. The LC South, LC West and LC North Projects were transferred to Lost Creek ISR, LLC in 2013. EN Project remains an asset of NFU Wyoming, LLC.
5.1.2 Ownership History of Adjoining Projects
The Adjoining Projects share a history of ownership similar to that of the Lost Creek Project because over the years they were operated by many of the same companies which maintained large property holdings in the vicinity. The Adjoining Projects have been acquired by URE since 2006 through the location of federal unpatented lode mining claims, purchase agreements made with individuals and companies, and through leases with the state of Wyoming. Additions which resulted in the formation of LC East and LC West were made through an asset exchange with Uranium One Americas, Inc. (U1) in 2012 and by staking of additional mining claims in 2011 and 2012, and 2014. The individual Projects originally were stand-alone exploration projects, but expanded over time such that now, along with the Lost Creek Project, they collectively represent a largely contiguous land position known as the Property.
5.1.2.1 LC East
LC East is drawn in part from two large blocks of claims (RD and PN claims) obtained in 2012 from U1, and additional mining claims located in 2011 and 2012, and 2014 by URE.
Similar to the other projects, the earliest historical ownership within what is now the LC East Project was by Wolf Land and Exploration in 1967. In 1969 Conoco entered into a joint venture with Wolf Land and Exploration, with Conoco acting as the operator. The next year Conoco took over the project and continued to explore the area as part of its “Project A”.
In 1978 Texasgulf continued the activity as the operator of “Project A” in a joint venture with Conoco until 1983. PNC Exploration later acquired some of the ground in 1987 and held it until 2000.
With the resurgence of the uranium industry, High Plains Uranium, Inc. (HPU) and Energy Metals Corporation (EMC) both staked claims within the current LC East Project boundaries in 2004. The HPU controlled claims subsequently were transferred to EMC in 2007 when that company acquired HPU. Later that year EMC was acquired by U1. U1 maintained the claims until they were acquired in 2012 by URE. Figure 3b shows the current LC East Project boundary and claims.
5.1.2.2 LC North
Early historic ownership of claims within what is now the LC North Project began in 1967 and continued into the mid-1970s. Activity was dominated by Conoco, at times in a joint venture with Inexco. Climax also held property in the late 1960s but to a much lesser extent. In the mid- to late-1970s Texasgulf continued as the primary operator until 1983 when they discontinued operations in the GDB.
Initial claim staking by URE in the LC North Project commenced in 2007 and various changes to the land position have been made in the years since. Figure 3c shows the current LC North Project boundary and claims.
| Ur-Energy – Lost Creek ISR Uranium Property Amended Technical Report Summary – September 19, 2022 | Page 27 |
|
|
|
5.1.2.3 LC South
Wolf Land and Exploration was the earliest operator within what is now the LC South Project and was active from 1967 to 1968. Conoco then became the dominant operator through the mid- 1970s, exploring the ground as part of their “Project A”. They were replaced by Texasgulf in 1978 when it took over operatorship of the “Project A” joint venture until 1983.
Acquisition by URE of the LC South Project began in 2007 and was expanded thereafter through location of claims and acquisitions of claims from third parties. Figure 3d shows the current LC South Project boundary and claims.
5.1.2.4 LC West
The earliest known operator on this ground was Wolf Land and Exploration who drilled only a few holes in 1967. Conoco controlled most of the ground in the early 1970s within its “Project A” and was later succeeded by Texasgulf in the mid-1970s to early 1980s when they took control of the “Project A” joint venture. Minerals Exploration Corporation also held portions of this ground in the early 1970s as part of their Sweetwater exploration activities. LC West, as currently known, was created from portions of the U1 asset exchange and through location of additional claims. Figure 3e shows the current LC West boundary and claims.
5.1.2.5 EN
The earliest operator in the EN area was Wolf Land and Exploration, which held portions of the current EN ground in the late 1960s. Humble (Exxon) also controlled portions of the land through 1970. Conoco entered into a joint venture with Wolf in 1969 and eventually assumed full control through 1974 as part of their “Project A”. Other operators who held portions of the ground during the 1970s include Teton Exploration, Kerr-McGee, and Climax (Amax). The last historical operator was Texasgulf who held the property in the late 1970s.
URE’s original land position arose through acquisition of claims from a private party in 2006. This was augmented with the staking of additional claims by NFU Wyoming, LLC and claims obtained through another acquisition. Figure 3f shows the current EN Project boundary and claims.
5.2 Exploration History
Significant exploration of the property began in the 1960s and has continued off and on by various operators since then. No significant uranium development work was conducted within the Property by previous operators. A summary of all historic and URE drill holes is presented in Table 4.
| Ur-Energy – Lost Creek ISR Uranium Property Amended Technical Report Summary – September 19, 2022 | Page 28 |
|
|
|
Table 4. Drill Hole Summary – Historical and Recent
|
| Plug Holes | Wells | Total | ||||
| Exploration | Delineation | Monitor/Pump Test Wells | Water Wells | Production Pattern Wells | # Holes | Footage | |
| Lost Creek Project | |||||||
| Historic Drilling | 552 |
| 11 |
|
| 563 | 360,388 |
| URE Drilling (Since 2005) | 244 | 1,138 | 290 | 9 | 1,145 | 2,826 | 1,591,071 |
| Drill Hole Totals | 796 | 1,138 | 301 | 9 | 1,145 | 3,389 | 1,951,459 |
| LC East Project | |||||||
| Historic Drilling | 1,063 |
|
|
|
| 1,063 | 472,994 |
| URE Drilling (Since 2011) | 22 | 176 | 29 |
|
| 227 | 135,237 |
| Drill Hole Totals | 1,085 | 176 | 29 |
|
| 1,290 | 608,231 |
| LC North Project | |||||||
| Historic Drilling | 175 |
|
|
|
| 175 | 117,947 |
| URE Drilling (Since 2007) | 131 |
|
| 1 |
| 132 | 132,455 |
| Drill Hole Totals | 306 |
|
| 1 |
| 307 | 250,402 |
| LC South Project | |||||||
| Historic Drilling | 488 |
|
|
|
| 488 | 229,166 |
| URE Drilling (Since 2007) | 159 |
|
| 1 |
| 160 | 101,950 |
| Drill Hole Totals | 647 |
|
| 1 |
| 648 | 331,116 |
| LC West Project | |||||||
| Historic Drilling | 68 |
|
|
|
| 68 | 44,480 |
| URE Drilling (Since 2011) |
|
|
|
|
|
|
|
| Drill Hole Totals | 68 |
|
|
|
| 68 | 44,480 |
| EN Project | |||||||
| Historic Drilling | 67 |
|
|
|
| 67 | 55,857 |
| URE Drilling (Since 2007) | 14 |
|
| 1 |
| 15 | 19,960 |
| Drill Hole Totals | 81 |
|
| 1 |
| 82 | 75,817 |
| Grand Totals - Lost Creek Property (All Projects) | |||||||
| Historic Drilling | 2,413 |
| 11 |
|
| 2,424 | 1,280,832 |
| URE Drilling (Since 2005) | 570 | 1,314 | 319 | 12 | 1,145 | 3,360 | 1,980,673 |
| Drill Hole Totals | 2,983 | 1,314 | 330 | 12 | 1,145 | 5,784 | 3,261,505 |
| Ur-Energy – Lost Creek ISR Uranium Property Amended Technical Report Summary – September 19, 2022 | Page 29 |
|
|
|
5.3 Previous Mineral Resource Estimates and Their Reliability
Several historic estimates of uranium mineral resources by previous operators have been made within the current Property. Most focused on what is now referred to as the MMT and EMT. However, because historical project boundaries varied considerably from the current project boundaries, direct comparison of historical estimates to current estimates is not possible.
Table 5 outlines various historical resource estimates covering areas within the Property that were conducted by several organizations since 1978. It also lists NI 43-101 mineral resource estimates for the Lost Creek Project/Property completed since 2006 through the 2016 PEA by URE. The historical resource estimates address diverse geographical areas, various host sand horizons, and utilize different and, in some instances, unknown resource determination methods. URE has not treated these historic estimates (Table 5) as current mineral resources or reserves and they are superseded by the current mineral resource estimate. Most of the earlier resource estimates did not differentiate resources in terms of currently recognized resource categories (Measured, Indicated, and Inferred). Mineral resource estimates in Table 5 are superseded by the resource estimates presented in this Report.
5.4 Production History
Regionally, historical production activities have been from the production of numerous underground and surface mines in the Crooks Gap / Sheep Mountain District approximately 25 miles to the north; at the Sweetwater Mine and Mill approximately three and one-half miles to the south; and limited ISR production in the Bison Basin approximately 27 miles to the northwest (Figure 2). All of these mining activities had ceased by the mid-1980s. Production at the Lost Creek Project commenced on August 2, 2013, and 2.7 million pounds of U3O8 have been produced up to December 31, 2021, from the Project. Elsewhere within the Property area, there has been no conventional or ISR production of uranium nor any pilot plant activities.
| Ur-Energy – Lost Creek ISR Uranium Property Amended Technical Report Summary – September 19, 2022 | Page 30 |
|
|
|
Table 5. Previous Resource Estimates
| Date | Company | Total Resource | Avg. Grade | Cutoffs | Tonnage Factor | Comments | LEVEL OF CONFIDENCE | ||||||
| Measured | Avg. Grade | Indicated | Avg. Grade | Inferred | Avg. Grade | ||||||||
| 10/4/1978 | Texasgulf (Freeman, Limbach) 1 | 8,246,876 | 0.045% | 10’-0.025% |
|
| — | — | 6,468,515 | 0.047% | 1,778,361 | 0.039% | |
| 2/1/1981 | DOE 4 | 6,378,000 | 0.057% | 0.03% |
| p. 31, in-place resources | Not differentiated | ||||||
| 2/1/1981 | DOE 4 | 8,908,571 | 0.041% | 0.02% |
| p. 31, in-place resources | Not differentiated | ||||||
| 2/9/1981 | Wyoming Minerals 2,5,4 | 11,008,893 | 0.073% | 5’-0.05% |
|
| Not differentiated | ||||||
| 6/5/1981 | Texasgulf 4 | 9,072,333 | 0.061% | 5’-0.03% |
| Polygon method | Not differentiated | ||||||
| April,1982 | Texasgulf (Mouillac & Stewart) 3, 8 | 5,715,413 | 0.062% | 5’-0.03% | 16.0 | Polygon method | Not differentiated | ||||||
| 3/31/1989 | PNC Exploration-Halliwell 5 | 8,072,334 | 0.061% | 5’-0.05% | 16.0 | Polygon method | Not differentiated | ||||||
| Jan. 1996 | PNC Exploration (F. Groth) 6 | 7,908,605 |
| 0.05% |
|
| Not differentiated | ||||||
| 5/31/2005 | URE (Douglas) 7 | 9,021,371 | 0.055% | .03%, GT.30 | 16.0 | Cumulative GT/hole | — | — | 8,122,287 | 0.055% | 900,000 | 0.055% | |
| 6/15/2006 | URE-NI 43-101 (Roscoe-Postle) 8,9 | See totals to right | 0.059% | 3’-.03%, GT.30 | 16.0 | Cumulative GT/hole (Ind + Inf) | — | — | 9,822,356 | 0.058% | 1,111,380 | 0.076% | |
| 10/30/2006 | URE (Douglas) 10 | 6,787,000 | 0.059% | .03%, GT.30 | 16.0 | Cumulative GT/horizon | Not differentiated | ||||||
| 4/2/2008 | URE-Amended NI 43-101 (Lyntek) 11 | See totals to right | 0.054% | .03%, GT.30 | 16.6 | Cumulative GT/hole (Ind + Inf) | — | — | 9,200,000 | 0.053% | 700,000 | 0.066% | |
| 3/16/2011 | URE -Prelim Assessment12 | See totals to right | 0.055% | .02%, GT.30 | 16.6 | GT Contour/horizon [HJ, KM only] | 2,655,000 | 0.052% | 2,568,000 | 0.060% | 783,000 | 0.051% | |
| 2/29/2012 | URE -Prelim Economic Assessment-(Cooper & Bull)13 | See totals to right | 0.055% | .02%, GT.30 | 16.6 | GT Contour/horizon [All Horizons] | 2,942,900 | 0.055% | 2,822,400 | 0.058% | 2,017,800 | 0.049% | |
| 4/30/2012 | URE -Prelim Economic Assessment-(Cooper & Bull)14 | See totals to right | 0.053% | .02%, GT.30 | 16.6 | GT Contour/horizon [All Horizons] | 4,198,800 | 0.055% | 4,149,400 | 0.053% | 2,869,100 | 0.049% | |
| 12/30/2013 | URE-Prelim Economic Assessment – (Roughstock) 15 | See totals to right | 0.051% | .02%, GT .30 | 16.6 | GT Contour/horizon [All Horizons] | 4,850,000 | 0.057% | 3,805,000 | 0.048 | 4,740,000 | 0.051% | |
| 6/17/2015 | URE-Technical Report – (Roughstock) 16 | See totals to right | 0.049% | .02%, GT .30 & .20 | 16.6 | GT Contour/horizon [All Horizons] | 6,196,000 | 0.049% | 3,909,000 | 0.047% | 5,037,000 | 0.049% | |
| 2/8/2016 | URE Amended Preliminary Economic Assessment 17 | See totals to right | 0.048% | .02%, GT .20 | 16.6 | GT Contour/horizon [All Horizons] | 8,028,000 | 0.048% | 6,223,000 | 0.044% | 7,368,000 | 0.044% | |
| 1 | Lost Creek- Conoco Reserves; P. Freeman, F. Limbach; October 4, 1978; Texasgulf internal report. |
| 2 | Appendix C, Resource Update as of 2/9/81; Unattached document, Texasgulf. |
| 3 | Geology and Control of the Uranium Mineralization on the “Main Mineral Trend” – Recommendations for the 1982 Program; J. Mouillac and M. Stewart, April 1982; Texasgulf internal report. |
| 4 | Lost Creek and Conoco Uranium Projects, Texasgulf Minerals and Metals, Inc.; January 1984, p. 31. |
| 5 | PNC Exploration (USA), Red Desert Project, D. Halliwell, March 31, 1989, p. 17. |
| 6 | ISL Addressable Reserve Estimate for PNC’s Red Desert Uranium Project, F. Groth; January 29, 1996; Internal report for PNC. |
| 7 | Evaluation of Resources, Lost Creek Uranium Deposit; Richard Douglas, May 31, 2005; Ur-Energy USA, internal report. |
| 8 | Technical Report on the Great Divide Basin Uranium Properties, Wyoming Prepared for Ur-Energy Inc.; Stewart Wallis, P. Geo, Roscoe Postle, June 15, 2005, Revised October 15, 2005. |
| 9 | Technical Report on the Lost Creek Project, Wyoming, NI 43-101 Prepared for Ur-Energy Inc.; Stewart Wallis, P. Geo, Roscoe Postle, June 15, 2006. |
| 10 | Geological Report on the Lost Creek Uranium Deposit; Richard Douglas, October 30, 2006, Ur-Energy Inc., internal report. |
| 11 | Amended NI 43-101 Preliminary Assessment for the Lost Creek Project, April 2, 2008, as amended February 25, 2011: J. Kyle, PE, D. Maxwell, PE, Lyntek, Inc. and Stewart Wallis, P. Geo. |
| 12 | Preliminary Assessment Lost Creek Property Sweetwater County, Wyoming; D. Graves, PE, M. Yovich, PE, TREC, Inc., and R. Maxwell, CPG, Behre Dolbear & Company (USA), Inc.; March 16, 2011 |
| 13 | Preliminary Economic Assessment of the Lost Creek Property, Sweetwater County, Wyoming; J. K. Cooper, SME Registered Member & C. L. Bull, PE, Ur-Energy Inc., February 29, 2012 |
| 14 | Preliminary Economic Assessment of the Lost Creek Property, Sweetwater County, Wyoming; J. K. Cooper, SME Registered Member & C. L. Bull, PE, Ur-Energy Inc., April 30, 2012 |
| 15 | Preliminary Economic Assessment of the Lost Creek Property, Sweetwater County, Wyoming; Douglass H. Graves, P.E. & Steve E. Cutler, C.P.G., December 30, 2013 |
| 16 | Technical Report on the Lost Creek Property, Sweetwater County, Wyoming, Douglass H. Graves, P.E. & Steve E. Cutler, C.P.G., June 17, 2015 |
| 17 | Amended Preliminary Economic Assessment of the Lost Creek Property, Sweetwater County, Wyoming; Douglass H. Graves, P.E. & James A. Bonner, C.P.G., February 8, 2016 |
| Ur-Energy – Lost Creek ISR Uranium Property Amended Technical Report Summary – September 19, 2022 | Page 31 |
|
|
|
6.0 GEOLOGICAL SETTING AND MINERALIZATION
6.1 Regional Geology
The Property is situated in the northeastern part of the GDB, which is underlain by up to 25,000 ft. of Paleozoic to Quaternary sediments (Figures 4 and 5). The GDB together with the Washakie Basin to the south comprise the eastern half of the greater Green River Basin, which occupies much of southwestern Wyoming. The GDB lies within a unique divergence of the Continental Divide and is bounded by structural uplifts or fault displaced Precambrian rocks, resulting in internal drainage and an independent hydrogeologic system.
GDB geology is dominated by the Eocene age Battle Spring Formation. Dominant Battle Spring Formation lithology is coarse arkosic sandstone, interbedded with intermittent mudstone, claystone and siltstone. Deposition occurred as alluvial-fluvial fan deposits within a south-southwest flowing paleo-drainage. The Granite Mountains approximately 30 miles to the north are the assumed sedimentary source, with possible minor contributions from volcanic sources. Maximum thickness of the Battle Spring Formation sediments within the GDB is 6,000 ft.
Approximately six miles west of the Property, the Battle Spring Formation interfingers with the Wasatch and Green River Formations of equivalent age (Eocene) within a belt roughly 15 miles wide, as shown in Figure 4. The Wasatch and Green River together represent low-energy fluvial, lacustrine and paludal depositional environments, which are time-equivalents of the alluvial fan deposits of the Battle Spring Formation.
Deep-seated regional thrust faulting associated with the Wind River thrusting occurred at depth in the central portions of the GDB. The horizontal component of displacement is possibly greater than nine miles. However, displacement does not extend to the surface. In addition, shallow normal faulting is also common throughout the GDB, having a preferential orientation generally east to west. These faults are relatively local and appear to be late-stage events in the structural history of the basin. Throws are generally less than 200 ft. and typically on the order of 25 to 50 ft. as illustrated by the Lost Creek Fault, discussed below. Strata within the GDB generally exhibit gentle dips of one to three degrees to the west and southwest, increasing to as much as 20 degrees in some locations along the basin margin. Gentle folding during late Eocene accompanied late-stage regional thrusting; therefore, broad anticlinal and synclinal folds are present within the Battle Spring Formation. Similar to the shallow normal faulting, the fold axes generally are oriented east-west.
6.2 Project Geology
Uranium deposits in the GDB are found principally in the Battle Spring Formation, which hosts the Property resources. Lithology within the Lost Creek deposit consists of approximately 60 percent to 80 percent poorly consolidated, medium to coarse arkosic sand beds up to 50 ft. thick, and 20 percent to 40 percent interbedded mudstone, siltstone, claystone and fine sandstone, each generally less than 25 ft. thick. This lithological assemblage remains consistent throughout the entire vertical section of interest in the Battle Spring Formation. Figure 7 illustrates a Type Log for the Lost Creek Project and is representative of the entire Property.
Outcrop within the Property is exclusively the Battle Spring Formation. Due to the friable nature of the formation, this occurs largely as sub-crop beneath the soil. The alluvial fan origin of the formation yields a complex stratigraphic regime subdivided throughout the Property into several thick horizons dominated by sands, with intervening named mudstones (Figure 7).
| Ur-Energy – Lost Creek ISR Uranium Property Amended Technical Report Summary – September 19, 2022 | Page 32 |
|
|
|
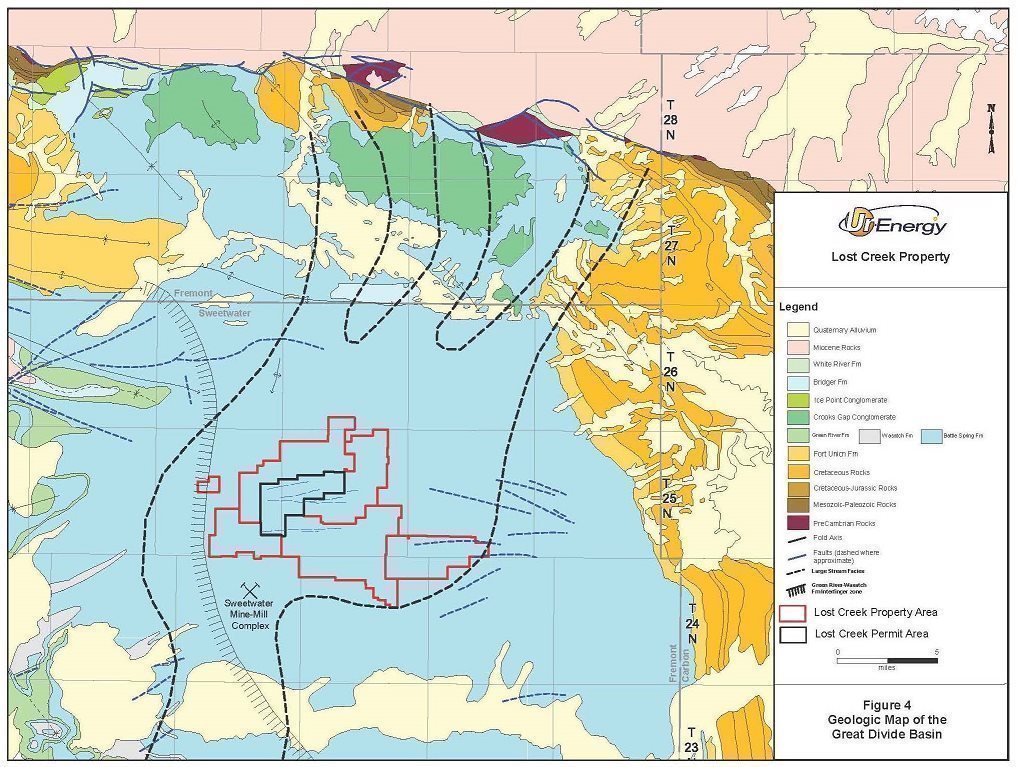
| Ur-Energy – Lost Creek ISR Uranium Property Amended Technical Report Summary – September 19, 2022 | Page 33 |
|
|
|
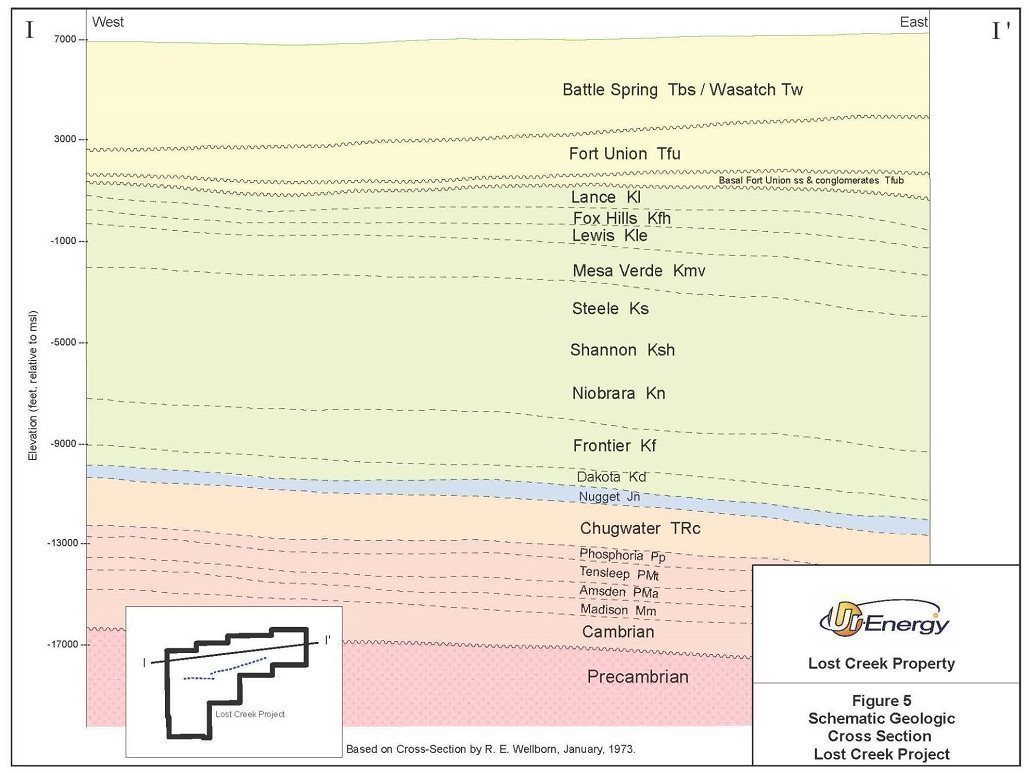
| Ur-Energy – Lost Creek ISR Uranium Property Amended Technical Report Summary – September 19, 2022 | Page 34 |
|
|
|
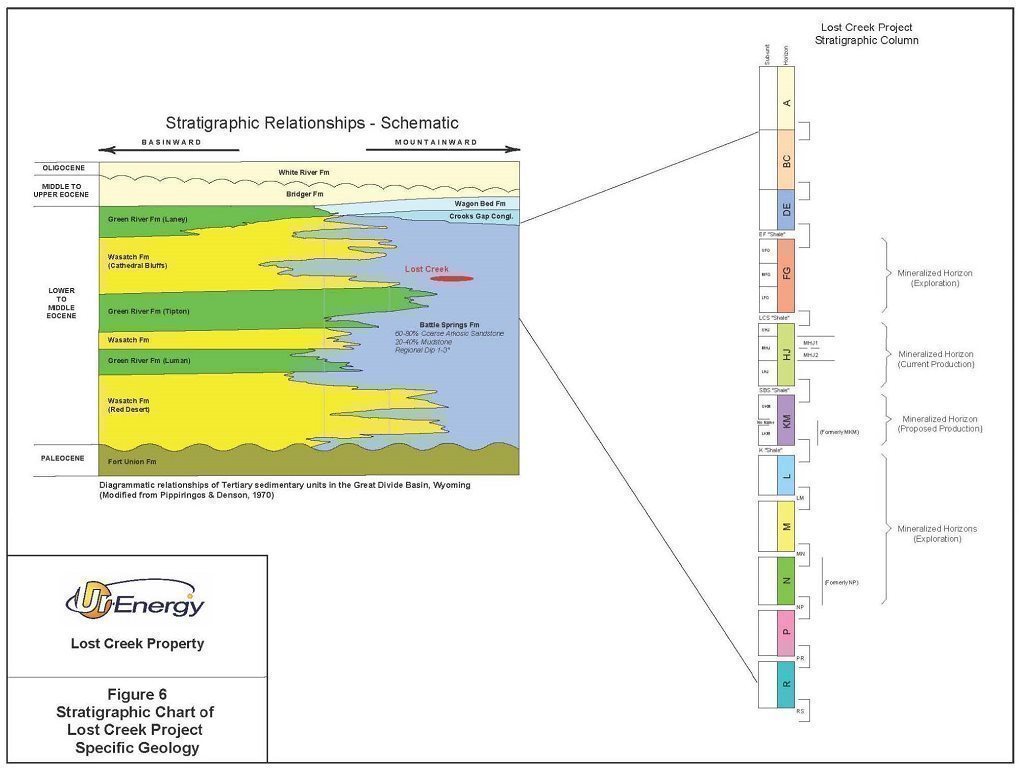
| Ur-Energy – Lost Creek ISR Uranium Property Amended Technical Report Summary – September 19, 2022 | Page 35 |
|
|
|
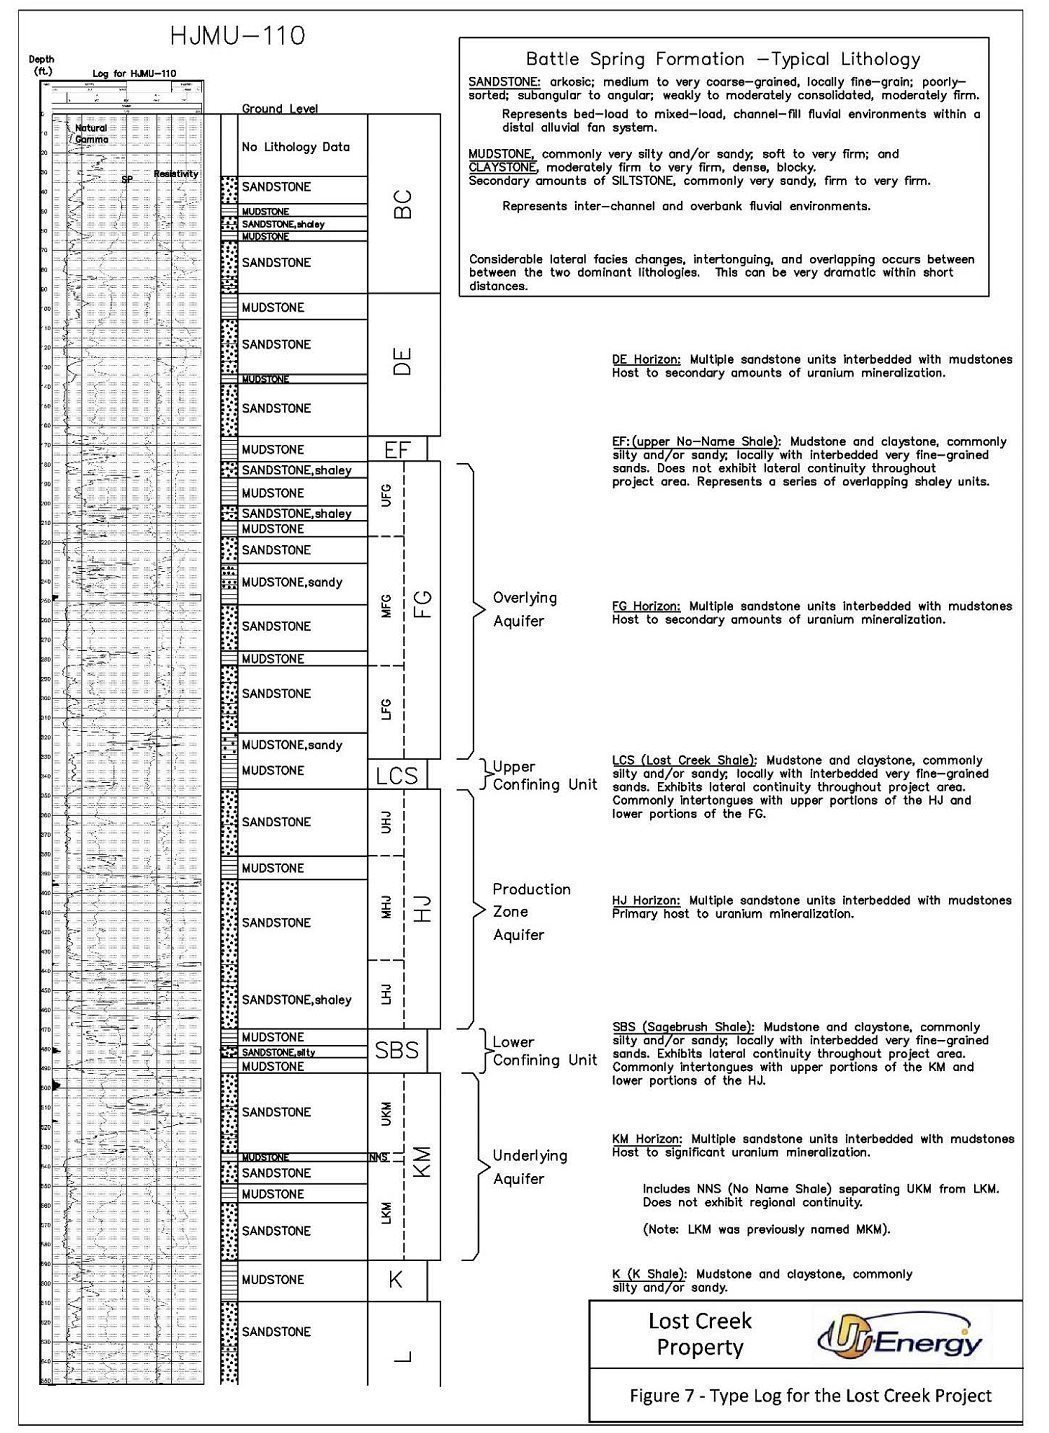
| Ur-Energy – Lost Creek ISR Uranium Property Amended Technical Report Summary – September 19, 2022 | Page 36 |
|
|
|
6.3 Stratigraphy
Provided below is a brief description of each named stratigraphic unit or “horizon” for the Property. Descriptions of lithology and thickness should be considered generalizations, and depths below ground surface (bgs) at which a given horizon can be encountered may vary considerably due to regional stratigraphic dip and displacement due to normal faulting. Figures 8a and 8b present cross-sectional views of this stratigraphic sequence within the MMT and EMT. The locations of these cross sections are shown on Figure 9.
DE Horizon -- The DE Horizon is locally absent in the northern and southern portions of the Property, having been removed by erosion. This horizon consists of a sequence of sands and discontinuous clay/shale units. In portions of the Lost Creek Project, the lower shale boundary is absent such that the sands of the DE Horizon coalesce vertically with sands of the underlying FG Horizon. In the Lost Creek Project, the top of the unit ranges from 80 to 200 ft. bgs and is approximately 80 ft. thick where the entire section is present.
EF Shale -- Underlying the DE is the EF Shale interval. It can be characterized as mudstone or claystone, interbedded commonly with silt and sand. This unit is not always present due to the coalescing nature of the DE and FG sands.
FG Horizon -- In the Lost Creek Project, the top of the FG Horizon occurs at depths of approximately 150 to 300 ft. bgs. The total thickness of the FG Horizon is approximately 160 ft. The FG is generally composed of fine to coarse-grained arkosic sands with thin discontinuous intervals of fine sand, mudstone and siltstone. Stratigraphically, the FG Horizon is subdivided into the Upper FG (UFG), Middle FG (MFG) and the Lower FG (LFG). The FG contains significant measurable uranium mineralization in both the Lost Creek and LC East Projects.
Lost Creek Shale (LCS) -- Underlying the FG Sands is the LCS. The LCS is continuous across the Property, ranging from 5 to 45 ft. in thickness. Typically, this unit has a thickness of 10 to 25 ft. Its lithology is dominated by silty mudstone and dense claystone. It commonly includes siltstone and may locally be sandy or contain thin lenticular sands.
HJ Horizon -- The HJ Horizon is the primary target for uranium production at the Lost Creek Project and is the dominant host for uranium in the MMT and EMT. The HJ Horizon has been subdivided into four sub-units: Upper HJ (UHJ), Middle HJ1 (MHJ1), Middle HJ2 (MHJ2) and the Lower HJ (LHJ). These sub-units are generally composed of course- grained arkosic sands, locally with thin discontinuous intervals of fine sand, siltstone and mudstone. Likewise, the four sub-units are separated by locally continuous mudstone and siltstone. The bulk of the uranium mineralization is present in the two MHJ sub-units. The total thickness of the HJ Horizon ranges from 120 to 140 ft., averaging approximately 130 ft. The top of the HJ Horizon ranges from approximately 300 to 450 ft. bgs within the MMT at the Lost Creek Project. The horizon shallows considerably to the north within the EMT in the LC East Project.
Sage Brush Shale (SBS) -- Beneath the HJ Horizon is the SBS. Within the Lost Creek Project, the top of this shale ranges from 450 to 550 ft. bgs. The SBS is laterally extensive and ranges from 5 to 75 ft. in thickness. Lithology of the SBS is typically that of claystone and mudstone with interbedded silts and thin sands.
| Ur-Energy – Lost Creek ISR Uranium Property Amended Technical Report Summary – September 19, 2022 | Page 37 |
|
|
|
KM Horizon -- The KM Horizon is present beneath the SBS. The KM Horizon is generally coarse sandstone with discontinuous fine sandstone and mudstone intervals. The KM has also been further subdivided into the Upper KM (UKM) and the Lower KM (LKM). The KM Horizon is host to a significant portion of mineralization within the Lost Creek Project and therefore is a potential production aquifer. It also hosts resources in the LC East Project within the EMT. The top of the KM Horizon is usually between 450 and 600 ft. bgs within the Lost Creek Project, but only approximately 300 feet bgs in the northern portions of the LC East Project.
L, M, and N Horizons -- These horizons are collectively referred to by URE as the “Deep Horizons” and occur immediately below the KM Horizon within a 300 to 350 ft. interval. They consist of lithologies identical to that of the HJ and KM Horizons. They remain targets of exploration. Individually, each is approximately 100 ft. thick and is composed of multiple, stacked, coarse sands, which are commonly separated by relatively thin, discontinuous shaley zones.
East-west oriented normal faulting is common within the central portions of the GDB. These appear to be the product of relatively late-stage structural adjustments. The last displacement of these faults is post-mineralization and has offset the uranium deposits. The MMT within the Lost Creek Project is bisected by a normal fault system, referred to as the Lost Creek Fault, consisting of two faults, roughly parallel, trending east-northeast to west-southwest. The easternmost main fault is downthrown to the south with a maximum displacement of approximately 80 ft. A secondary fault is positioned along the western portion of the MMT and is located 800 to 1,600 feet south of the easternmost fault to which it is sub-parallel. This westernmost fault displays opposite displacement, downthrown to the north, with a maximum displacement of approximately 50 ft. Pump-testing and monitoring on both sides of both faults have demonstrated that the fault planes are effectively sealed within the HJ Horizon and thus represent hydrologic barriers or boundary conditions. The Lost Creek Fault is taken into consideration by wellfield planning and to date has not had a significant impact on production.
Faults have also been identified in the southern portions of LC East Project, which exhibit displacement of from 40 ft. to 80 ft. and may be systemically related to the Lost Creek Fault. The resulting opposing displacements on many of these faults produce horst and graben features that are local to portions of the Property. The presence of these faults will be a matter of consideration for production planning at LC East but, like the Lost Creek Fault, they are not considered to be significant obstacles. Additional significant faults have been identified within the Property but are sufficiently distant as to have minimal effect on planned production.
| Ur-Energy – Lost Creek ISR Uranium Property Amended Technical Report Summary – September 19, 2022 | Page 38 |
|
|
|
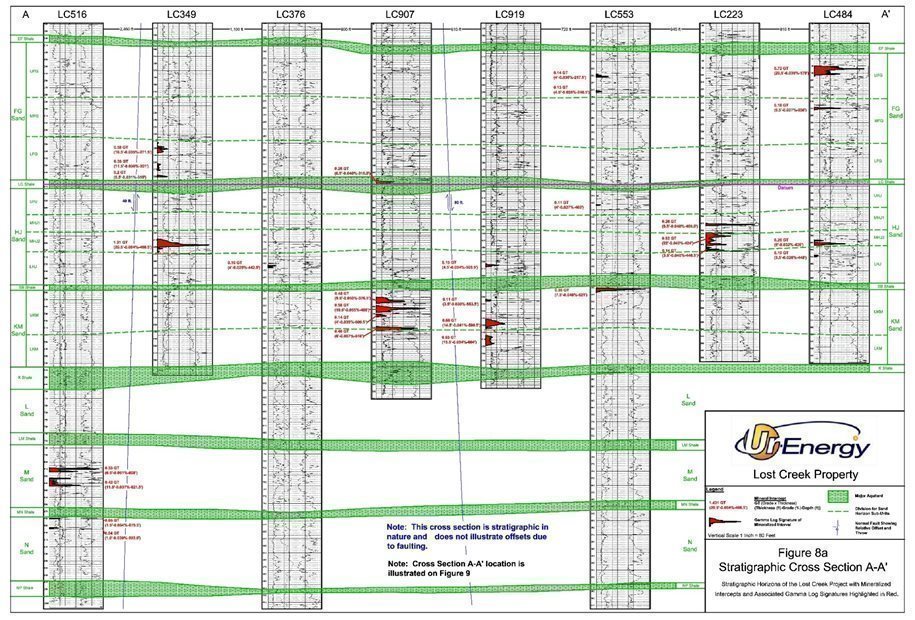
| Ur-Energy – Lost Creek ISR Uranium Property Amended Technical Report Summary – September 19, 2022 | Page 39 |
|
|
|
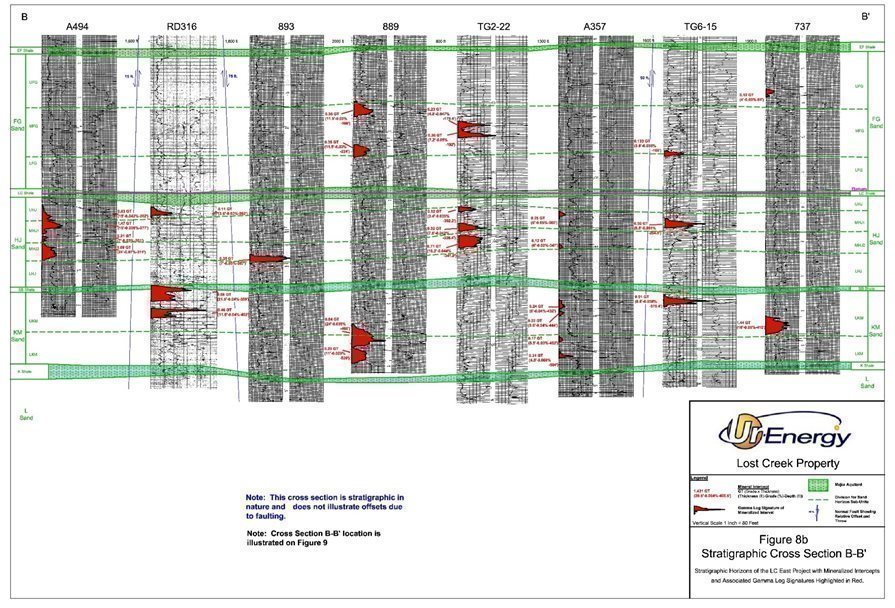
| Ur-Energy – Lost Creek ISR Uranium Property Amended Technical Report Summary – September 19, 2022 | Page 40 |
|
|
|
6.4 Mineralization of the Lost Creek Property
Mineralization at the Lost Creek Project and Adjoining Projects occurs as roll front type uranium deposits.
Mineralization occurs in sand horizons within the Eocene-age Battle Spring Formation. The most significant mineral resources in the Property occur within two major stratigraphic horizons, the HJ and the KM Horizons. The HJ Horizon contains most of the currently defined mineral resources and hosts the current production zones. As discussed earlier, the HJ Horizon is subdivided into four stratigraphic sub-horizons that are also used for resource reporting. The highest abundance of uranium mineralization occurs in the MHJ1 and MHJ2 sub-horizons. Each sub-horizon, in turn, may consist of multiple mineralized roll fronts. The HJ Horizon, as a whole, contains up to 11 individual roll fronts within a stratigraphic interval of approximately 130 ft.
The KM Horizon underlies the HJ Horizon and contains additional significant mineralization that will be targeted for future production later in the Lost Creek mine plan. Mine approvals for the KM Horizon have and will be addressed by amendments to the mine license and permits. To date, a total of nine individual roll fronts have been identified in the KM Horizon within a stratigraphic interval of approximately 100 ft.
Mineral resources that are currently targeted for mining in the Property occur within two major trends. In the Lost Creek Project, resources are focused in the east-west oriented MMT that is approximately three miles long and 500 to 2,000 ft. wide (Figure 9). Mineralization targeted for mining has also been identified within the underlying KM Horizon and the overlying FG Horizon.
A second mineralized trend of significance, the EMT, was identified by historical drilling within the LC East Project (Figure 9). Although geologically similar, it appears to be a separate and independent trend from the MMT and is believed to be the product of a different mineralization system. The EMT assumes a generalized northeast-southwest orientation extending for approximately six and one-half miles with a width of 500 to 1,500 ft. As in the MMT, the known mineralization occurs mainly in the HJ and KM Horizons. Significant occurrences have also been identified in the FG Horizon.
Geological evaluations of historical and URE drill data have resulted in the recognition of numerous additional uranium occurrences within the Property. Historical exploration drilling by previous operators was conducted within all project areas. In addition, URE has conducted exploration drilling in the LC North, LC South, and EN Projects plus limited exploration drilling in LC East.
Mineralization has also been recognized throughout the Property in horizons deeper than the KM, in what are referred to as the Deep Horizons (L, M and N). Recent and historical drill hole data confirm multiple roll fronts with locally identified Inferred resources in these horizons. URE anticipates conducting future exploration drilling to further define the resource potential of these stratigraphic horizons.
| Ur-Energy – Lost Creek ISR Uranium Property Amended Technical Report Summary – September 19, 2022 | Page 41 |
|
|
|
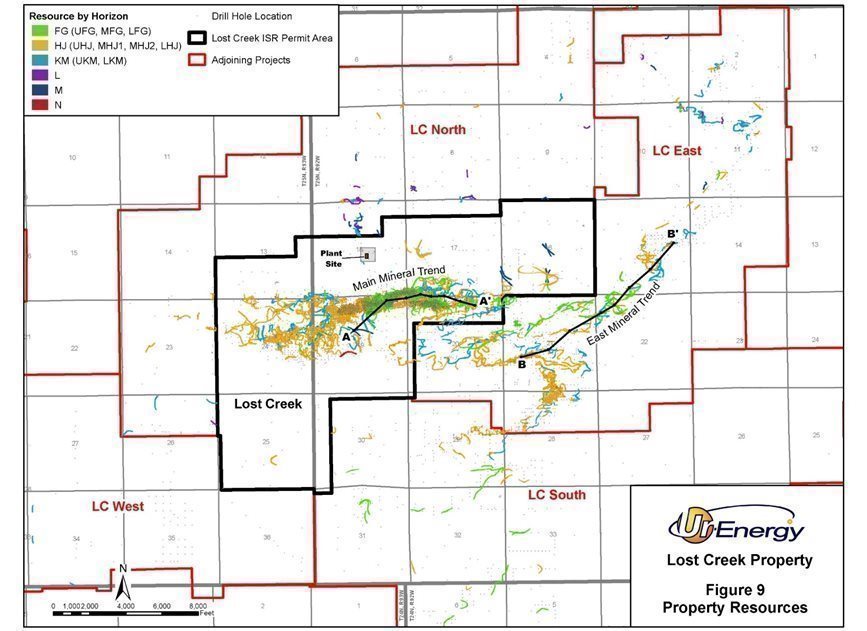
| Ur-Energy – Lost Creek ISR Uranium Property Amended Technical Report Summary – September 19, 2022 | Page 42 |
|
|
|
Mineralogy of the zones of interest has been studied in thin section and by x-ray diffraction analysis. Mineralogical analyses were conducted in 1979 by Russell Honea (Honea, 1979a and b), and in 2007 by Hazen Research, Inc. (Hazen Research) (Hazen, 2007) on samples derived from core. Results indicate that the uranium occurs primarily as the mineral coffinite (uranium silicate) in the form of micron- to submicron-size inclusions disseminated in and on interstitial clay, possibly absorbed by cation exchange; also intimately interspersed through some of the pyrite and as partial coatings on quartz and biotite. Minor amounts of uraninite (uranium oxide) and brannerite (uranium-titanium oxide) have also been identified. Clay rich fractions are predominantly smectite (montmorillonite), with minor kaolinite.
The Hazen Research analysis concluded that uranium should be recoverable by an ISR operation because of the unconsolidated nature of the sandstone and expected diffusion of the lixiviant through the smectite clays. Recoverability has been confirmed by leach testing and by production results in the first nine years of production.
6.5 DEPOSIT TYPE
Uranium mineralization identified throughout the Property occurs as roll front type deposits, typical in most respects of those observed in other Tertiary Basins in Wyoming. Figure 10 schematically illustrates the geometry and mineralogical model of a typical roll front uranium deposit. The formation of roll front deposits is largely a groundwater process that occurs under favorable geochemical conditions. The most favorable host rocks for roll fronts are permeable sandstones within large aquifer systems. Interbedded mudstone, claystone and siltstone are often present and aid in the formation process by focusing groundwater flow.
The geometry of mineralization is dominated by the classic roll front “C” shape or crescent configuration at the alteration interface. The highest-grade portion of the front occurs in a zone termed the “Nose” within reduced ground just ahead of the alteration front. Ahead of the Nose, at the leading edge of the solution front, uranium quantity gradually diminishes to barren within the “Seepage” zone. Trailing behind the “Nose”, in oxidized (altered) ground, are weak remnants of mineralization referred to as “Tails” which have resisted re-mobilization to the Nose due to association with shale or other lithology of lower permeability. Tails are generally not amenable to in situ recovery because the uranium is typically within strongly reduced or impermeable strata, therefore making it difficult to leach.
The source of the uranium within the Property is speculative. Boberg (2010) suggests that the source within this portion of the Wyoming Uranium Province is a combination of leaching of uraniferous Oligocene volcaniclastics that once covered the basins and the weathering and leaching of uraniferous Archean granite of the Granite Mountains (north of the GDB) which also represent the provenance of the arkosic sands comprising the Battle Spring Formation.
Oxygenated surface water passing through the overlying thick sequences of volcaniclastic material may have leached metals, including uranium. These metal-enriched fluids may have also leached additional uranium from the arkosic sands that compose the aquifers. The enriched, oxidizing fluids subsequently entered the regional groundwater systems within the basin and migrated down-dip through the aquifers as large oxidizing geochemical cells referred to as solution fronts.
| Ur-Energy – Lost Creek ISR Uranium Property Amended Technical Report Summary – September 19, 2022 | Page 43 |
|
|
|
Uranium precipitated in the form of roll front deposits at the leading edge of the geochemical cells where the transporting water encountered reducing geochemical environments within the host sands. Uranium quantity was enhanced where groundwater flux was focused horizontally by paleochannels or vertically by aquitards. Continuity of these conditions produced a significant accumulation of uranium at the reduction-oxidation (redox front) interface. In addition, the continued supply of oxygen to the interface leads to degradation of the reduced strata and resulted in migration down-gradient of the redox interface, thus remobilizing the associated uranium with it. In this manner the uranium deposit slowly migrated down-dip over geologic time.
The reducing environment in the host sand is generally induced by carbonaceous material within the formation or leaked reductant gases originating from deep hydrocarbon sources. Pyrite is inherently associated with both and is a significant indicator of a reducing environment. Reduced sands are typically some shade of gray and represent the regional framework prior to mineralization. The reducing environment is subsequently altered by the passage of the oxidizing solution front. Alteration typically involves oxidation of pyrite and other iron bearing minerals to hematite or limonite/goethite and destruction of carbonaceous material. As a result, altered (oxidized) sands are typically reddish or yellowish in color. Mineralized zones within a roll front vary considerably in size and shape, but are generally long, narrow, and sinuous in map view. The total length of a mineralization trend may extend for several miles. Commonly, a deposit or mineralized trend will consist of a composite of multiple, vertically stacked roll fronts.
Typical width of an individual roll front is generally 25 to 100 ft. However, in the case of multiple stacked fronts, the composite width may be several hundred feet across. Typical thickness of an individual roll front is roughly 5 to 25 ft., and the composite thickness of multiple, vertically stacked fronts may occupy as much as 200 ft.
As described above, the MMT, EMT and extension trends throughout the Property are the product of large regional geochemical alteration systems which resulted in a complex composite of multiple, stacked roll fronts at the reduction-oxidation interface. The roll front model and associated mineralized trends are the basis upon which the exploration and development programs are planned.
| Ur-Energy – Lost Creek ISR Uranium Property Amended Technical Report Summary – September 19, 2022 | Page 44 |
|
|
|
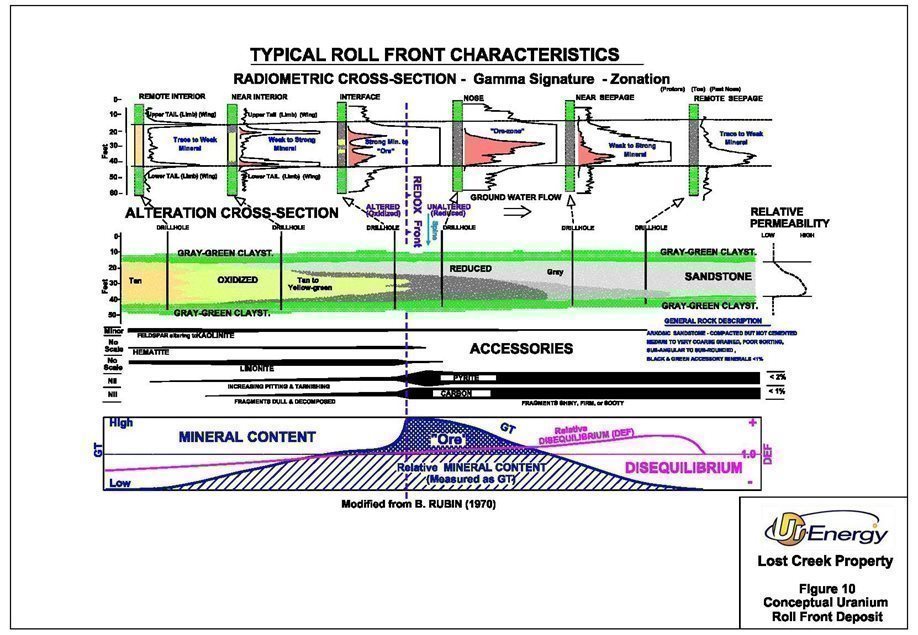
| Ur-Energy – Lost Creek ISR Uranium Property Amended Technical Report Summary – September 19, 2022 | Page 45 |
|
|
|
7.0 EXPLORATION
No non-drilling exploration surveys have been conducted by URE on the Property. However, an extensive listing of historical and URE exploration, delineation and development drilling is shown in Table 4 and depicted on Figure 9. Existing uranium resources within the property boundaries were estimated using data from this table, including the use of historical down-hole electric logs, lithology logs, drill hole location maps, summaries of mineralized drill hole intercepts and survey coordinates for drill holes. Procedures used in the verification and utilization of these historical data, as well as results of this evaluation, are described in Chapter 9.0 Data Verification and Chapter 11.0 Mineral Resource Estimate.
7.1 Drilling
7.1.1 Historic Drilling
Significant uranium exploration within the general area that comprises the Property began in the mid-1960s. In the late 1960s, several companies conducted early regional drilling operations, including Climax, Wolf Land and Exploration (Inexco), Humble Oil and Conoco Minerals. Climax held claims west of Conoco’s “Project A” but conducted only cursory exploration on them during the early 1970s. By the mid-1970s, exploration drilling was conducted primarily by Texasgulf and Conoco Minerals.
PNC Exploration carried out limited in-fill exploration drilling and geological evaluations in the area of the MMT until 1996, before selling the property in 2000. No other exploration activities were conducted until acquisition of the Lost Creek Project by URE in 2005.
URE is in possession of all known historical drilling data, maps, and reports from Conoco, Texasgulf and PNC Exploration activities. This includes:
|
| · | Geophysical logs (including gamma logs), |
|
|
|
|
|
| · | Cutting sample and core descriptions for most holes, Uranium intercept databases, |
|
|
|
|
|
| · | Location maps and drill location coordinates, Geological interpretation maps, |
|
|
|
|
|
| · | Geological and resource estimation reports, Metallurgical reports, and |
|
|
|
|
|
| · | Chemical analyses. |
7.1.1.1 Lost Creek Project: Drilling History
The Lost Creek Project is now in production. Additionally, varying stages of late-stage exploration and development work will continue.
|
| · | Drilling within the current Lost Creek Project area during the period from 1966 to 1976 consisted of approximately 115 wide-spaced exploration holes by several companies including Conoco, Climax and Inexco. |
|
|
|
|
|
| · | Texasgulf conducted extensive exploration operations from 1976 through 1982, including 412 drill holes, of which 401 were exploration holes and 11 were monitor and pump test wells. |
|
|
|
|
|
| · | PNC Exploration explored the Lost Creek Project area from 1987 through 1992, completing 36 drill holes. |
|
|
|
|
|
| · | PNC sold the properties to New Frontiers Uranium, LLC in 2000. At the time URE acquired the Project in 2005, a total of 552 exploration holes and 11 monitor and pump-test wells had been drilled. The pump-test wells were subsequently plugged and abandoned prior to acquisition by URE. The MMT was well identified and drilled-out to varying degrees of confidence. |
| Ur-Energy – Lost Creek ISR Uranium Property Amended Technical Report Summary – September 19, 2022 | Page 46 |
|
|
|
7.1.1.2 LC East Project: Drilling History
The LC East Project has been extensively drilled in the past and can be considered to be in the mid- to late-stage of exploration in the northern portions to pre-development in the southern portions.
|
| · | The earliest drilling was started in 1967 by Inexco who was later joined in a joint venture by Conoco in 1969. Also, in 1967 Hecla Mining drilled one exploration hole on what is currently the LC East Project. |
|
|
|
|
|
| · | Conoco continued to drill the property through 1977. By that time, approximately 916 exploration holes had been drilled, including 13 core holes. Abundant significant uranium mineralization had been found and a well-defined mineralized trend identified, which is currently referred to as the EMT. |
|
|
|
|
|
| · | In 1978 Texasgulf continued defining the trend by drilling an additional 126 exploration holes through 1981, including three core holes of very shallow targets (less than 150 ft.). |
|
|
|
|
|
| · | Portions of the current LC East Project were explored by PNC Exploration from 1987 to 1990. They drilled 21 holes within the current LC East Project in conjunction with their activities on the MMT in the Lost Creek Project. |
|
|
|
|
|
| · | Prior to acquisition by URE in 2005, a total of 1,063 exploration holes, for a total of 474,582 ft. of drilling, had been drilled within the currently defined LC East Project, including one water well which has since been abandoned. Drilled depths average 446 ft. |
7.1.1.3 LC North Project: Drilling History
The LC North Project is currently in the early to middle stage of exploration.
|
| · | The earliest exploration on record was several wide-spaced ‘wildcat’ drill holes in 1967 by Hecla Mining and Wolf Land and Exploration. This was followed in the late 1960s and early 1970s by more ‘wildcat’ drilling by Conoco, Inexco and Climax. Conoco also conducted some wide-spaced fence-line drilling in a few areas of interest. In the late 1970s and early 1980s Texasgulf conducted some medium to wide-spaced drilling as part of their program. A minor amount of drilling was also conducted on the Property in this time frame by Minerals Exploration Company and Wold Nuclear. |
|
|
|
|
|
| · | 175 exploration holes had been drilled within the Project prior to acquisition by URE. Drilled depths ranged from 100 ft. to 1,200 ft., with an average of 600 ft. |
| Ur-Energy – Lost Creek ISR Uranium Property Amended Technical Report Summary – September 19, 2022 | Page 47 |
|
|
|
7.1.1.4 LC South Project: Drilling History
The LC South Project is currently in the middle stage of exploration.
|
| · | The earliest exploration on record was several wide-spaced ‘wildcat’ drill holes in 1967 by Wolf Land and Exploration. Between 1970 and 1975 Conoco drilled a few hundred holes within the current LC South Project. Minerals Exploration Company also drilled a few holes in 1969 within portions of land they controlled. In 1980 and 1981, Texasgulf extended drilling activities into the current LC South Project area with approximately 150 drill holes. |
|
|
|
|
|
| · | The southern portions of LC South were extensively drilled by Minerals Exploration Company in 1982. Approximately 101 holes were drilled to an average depth of 230 ft. |
|
|
|
|
|
| · | 488 exploration holes were drilled within the current LC South Project prior to acquisition by URE. Historical drilling encountered numerous mineralized trends that were investigated mainly by fence-line drilling. |
7.1.1.5 LC West Project: Drilling History
The LC West Project has only limited historical drilling and remains in the early stage of exploration.
|
| · | A total of 68 historical drill holes (approximately 44,564 ft.) are present within the Project. Wolf Land and Exploration drilled a few wide spaced holes in 1967, followed by several holes drilled by Conoco in the early 1970s. Texasgulf drilled approximately 33 exploration holes in portions of the Project between 1976 and 1981. Finally, Minerals Exploration Company drilled approximately 20 holes. |
7.1.1.6 EN Project: Drilling History
The EN Project is currently in the early stage of exploration.
|
| · | Prior to acquisition by NFU Wyoming, LLC, exploration within what is now the EN Project consisted entirely of wide-spaced historical drilling. Between the late-1960s and mid-1970s, approximately 67 holes were drilled and logged by several companies, primarily Conoco, and Humble Oil (Exxon); with minor contributions by Kerr-McGee and Teton Exploration. The earliest known exploration was conducted by Wolf Land and Exploration in 1967. Virtually no activity occurred after the late 1970s. URE has drilled 14 exploration holes at the EN Project. |
7.1.2 Drilling By URE
URE and earlier owners have conducted extensive drill programs in the area of the Property, as demonstrated in Table 4. Data from this drilling forms the basis of much of the present mineral resource estimation. Since October 15, 2015 (the data cutoff date of the 2016 PEA), until commencement of the MU2 HH 2-4 development and construction program in 2021Q4, URE drilled an additional 204 holes and wells totaling 95,668 ft. The majority of these were a result of continued development drilling within MU2 and the completion of HH2-1 through HH2-3. In MU1, 18 additional delineation holes were drilled to test continuity of mineral resources not currently under pattern. Eight additional monitor wells were installed to aid in the operation of MU1 and MU2, and seven additional monitor wells were installed in LC East to assist in further characterization of the aquifer underlying the production zones.
The 171 new pattern wells drilled during the construction of HHs 2-1 through 2-3 resulted in an increase of the estimated mineral resource from 2,787,000 lbs. to 2,997,000 lbs. The 210,000-pound increase is attributed to the new drill hole data collected and a revision of the roll front mapping for the area. As is typical in development drilling, the data density increase as a result of pattern installation will often result in a slight increase in resource.
| Ur-Energy – Lost Creek ISR Uranium Property Amended Technical Report Summary – September 19, 2022 | Page 48 |
|
|
|
Drilling for these first three HHs in MU2 was complete in late 2017. As a result of a depressed uranium market, URE has conducted no further major drilling or development programs since. In 2021, following positive developments in the market, URE re-initiated MU2 development drilling. This drilling is in progress and is planned in two programs: HH2-4 development and construction, during which all pattern wells will be installed, followed by delineation drilling of approximately 120 holes to assist in pattern design for HH2-5 through 2-8.
The QP did not identify any drilling, sampling or recovery factors that could materially impact the accuracy and reliability of the resource estimates presented in this Report.
7.2 Hydrogeology
Due to a divergence in the Continental Divide, within the northeastern portion of the GDB, the basin is hydrologically closed, with all surface water draining to the interior of the basin. Available data suggest that groundwater flow within the basin is predominately toward the interior of the basin (Collentine, et al., 1981 and Welder, G.E. and McGreevey L.J, 1966).
Most of the surface water is runoff from precipitation or snowmelt. It quickly infiltrates the vadose zone and recharges the shallow groundwater, evaporates, or is consumed by plants through evapotranspiration. The shallowest aquifer within the Battle Spring Formation underlying the Property area is unconfined, poorly consolidated, and poorly stratified. The shallow water table is typically 80 to 150 ft. bgs.
Green Mountain, which is approximately 15 miles north of the Property, is a major recharge area for aquifers within the northeastern portion of the GDB (Fisk, 1967). The Rawlins Uplift, Rock Springs Uplift, and Wamsutter Arch, located east, southwest, and southeast, respectively, from the Property, are also identified as major recharge areas for aquifers within the GDB (Fisk, 1967). The main discharge area for the Battle Spring/Wasatch aquifer system is a series of lakes, springs and playa lake beds near the center of the basin. Groundwater potentiometric elevations within the Tertiary aquifer system in that portion of the basin are generally near the land surface.
The Battle Spring Formation crops out over most of the northeastern portion of the GDB, including all of the Property. It is considered part of the Tertiary aquifer system by Collentine (Collentine, et al., 1981), which is viewed as a hydrogeologic sequence of interest within the GDB. This regional aquifer system includes the laterally equivalent Wasatch Formation (to the west and south) and the underlying Fort Union and Lance Formations (Figure 5). The base of the Tertiary aquifer system is marked by the top of the Lewis Shale. The Lewis Shale is generally considered a regional aquitard, although this unit does produce limited amounts of water from sandstone lenses at various locations within the GDB and to the south in the Washakie Basin. Units deeper than the Lewis Shale are generally too deep to economically develop for water supply or have elevated total dissolved solid concentrations that render them unusable for human consumption. Exceptions to this can be found along the very eastern edge of the basin, tens of miles from the Property, where some Lower Cretaceous and older units provide relatively good quality water from shallow depths.
Shallower aquifer systems that can be significant water supply aquifers within the GDB include the Quaternary and Upper Tertiary aquifer systems. The shallower aquifer systems are important sources of groundwater only in localized areas, typically along the margin of the basin where the Battle Spring Formation is absent. Aquifer systems beneath the Tertiary include the Mesaverde, Frontier, Cloverly, Sundance-Nugget and Paleozoic aquifer systems (Collentine, et al., 1981). In the northeast GDB, these aquifer systems are important sources of water only in the vicinity of their outcrops near structural highs such as the Rawlins Uplift; elsewhere they are too deep.
| Ur-Energy – Lost Creek ISR Uranium Property Amended Technical Report Summary – September 19, 2022 | Page 49 |
|
|
|
Regional hydrologic units of interest within the northeast GDB from deepest to shallowest (see Figure 5) include the following:
|
| · | Lewis Shale (aquitard between Tertiary aquifer system and Cretaceous Mesaverde aquifer system). |
|
|
|
|
|
| · | Fox Hills Formation (Cretaceous). |
|
|
|
|
|
| · | Lance Formation (Tertiary aquifer system). |
|
|
|
|
|
| · | Fort Union Formation (Tertiary aquifer system). |
|
|
|
|
|
| · | Battle Spring Formation-Wasatch Formation (Tertiary aquifer system). |
|
|
|
|
|
| · | Undifferentiated Tertiary Formations (Upper Tertiary aquifer system, including Bridger, Uinta, Bishop Conglomerate, Browns Park, and South Pass). These units are not present within the Property. |
|
|
|
|
|
| · | Undifferentiated Quaternary Deposits (Quaternary aquifer system). |
Nomenclature for the hydro-stratigraphic units of interest within the Property is synonymous with the Property’s stratigraphic horizon names (Figure 6). The shallowest occurrence of groundwater within the Lost Creek Project area occurs near the base of the DE Horizon. The DE Horizon, however, is not saturated in all portions of the Property and is not defined as a groundwater unit. Below the DE is the FG Horizon, which is the first major saturated unit. The basal sand unit of the FG Horizon is designated as the overlying aquifer for the underlying HJ Horizon.
7.2.1 Hydraulic Properties
Numerous hydrogeologic tests have been performed within the Lost Creek and LC East Projects to demonstrate that the HJ and KM Horizons are sufficiently transmissive to allow the lixiviant to flow through the production zone and dissolve the uranium mineral.
|
| · | A long-term pump test and several shorter-term pump tests (Petrotek Engineering Corporation, 2007, 2009, 2013) (Hydro-Engineering, 2007), plus the pump tests conducted for Texasgulf (Hydro-Search, Inc., 1982), were used to evaluate hydrologic properties of the aquifers of interest, to assess hydraulic characteristics of the confining units, and to evaluate impacts to the hydrologic system of the Lost Creek Fault through the Lost Creek Project. |
|
|
|
|
|
| · | In 2011, hydrologic investigations were conducted to provide support for a proposed amendment application to include the KM Horizon within RA3 in current state and federal permits. A regional pump test was completed in the KM Horizon in RA3 at a pumping well located south of the Lost Creek Fault. The testing objectives were to: 1) evaluate the hydrologic aquifer characteristics, 2) demonstrate hydrologic communication between the KM Horizon pumping well and the surrounding monitor wells, 3) evaluate the presence of hydrologic boundaries, and 4) demonstrate isolation between the KM Horizon and the overlying and underlying horizons sufficient for the purposes of ISR mining. The test results indicated: 1) varying amounts of hydraulic communication between the two underlying L and M Horizons, thus indicating that the KM Horizon is hydraulically connected, 2) drawdown responses in the overlying HJ Horizon and the lowermost N Horizon were minor, and 3) the Lost Creek Fault acts as a partial barrier to flow as a zone of lower permeability. |
| Ur-Energy – Lost Creek ISR Uranium Property Amended Technical Report Summary – September 19, 2022 | Page 50 |
|
|
|
|
| · | In 2012, “5-spot” hydrologic testing was completed in the KM Horizon in RA3, which supplemented the regional pump test conducted in 2011. The purpose of the testing was to assess the level of hydraulic communication between the KM Horizon (potential production zone) and the underlying L, M and N Horizons and also the overlying HJ Horizon within a pattern of wells simulating a typical commercial scale five-spot production pattern. Hydrologic testing conducted in the KM Horizon indicated varying amounts of hydraulic communication between the two underlying L and M Horizons confirming that these horizons are hydraulically connected. Based on hydrologic testing results to date, it is anticipated that the minor communication between the KM Horizon and the overlying and underlying horizons can be managed through operational practices, detailed monitoring, and engineering operations. |
|
|
|
|
|
| · | In 2013, a mini-pump test was conducted in MU2 for the purpose of assessing the level of hydraulic communication between the HJ Horizon and the overlying and underlying horizons, with the focus on the role that historical exploration drill holes might play in cross-aquifer communication. Based on the minimal or lack of response observed in the overlying and underlying horizon observation wells, the abandoned historical exploration drill holes appear sealed and are not providing a flow conduit between the horizons in the tested area. |
|
|
|
|
|
| · | In the LC East Project area, URE installed 26 monitoring wells into the various FG, HJ, KM and N Horizons. In 2013, regional hydraulic pump tests were conducted using these wells. To evaluate aquifer characteristics, two pump tests were conducted in the HJ Horizon and three tests were conducted in the KM Horizon. Results demonstrated there was no measurable hydraulic communication between the HJ and KM Horizons, as well as no measurable hydraulic conductivity with the underlying N Horizon. Preliminary findings indicate that the mapped faults are not sealed but act as low-flow boundaries. The pump tests results demonstrate that the HJ and KM Horizons have sufficient transmissivity for ISR operations. |
The hydraulic properties are consistent with those at other successful ISR operations. While production well flow rates observed to date confirm very good aquifer characteristics, injection capacity is the limiting factor in the final wellfield production rates. LC has been successfully operating the Lost Creek Mine since August 2013. This further demonstrates that the aquifers are amenable to ISR production.
In addition, several lab tests have been carried out on core samples from the Lost Creek Project to ensure leachability with an acceptable lixiviant. Test results demonstrate leach amenability as well as minimal presence of product contaminants in the leachate. At the LC East Project additional baseline monitor well installations were completed in 2012. These have demonstrated that the static water table and hydrogeological conditions in the southern portions of LC East are similar to those at the Lost Creek Project and amenable to ISR extraction. However, in the northern extremes of the Property the strata shallow considerably such that mineralization within the HJ Horizon is present under unconfined water table conditions which may make ISR extraction difficult. Potential mining activity in this area is focused on the KM Horizon, which remains under suitably confined groundwater conditions.
| Ur-Energy – Lost Creek ISR Uranium Property Amended Technical Report Summary – September 19, 2022 | Page 51 |
|
|
|
7.2.2 QP Comment on Results
The pump test results provide sufficient characterization of Project hydrogeology to demonstrate that the Property has sufficient geologic confinement and transmissivity for ISR operations in the permitted wellfields. In the opinion of the QP, adequate aquifer testing has been conducted to characterize the Property for regulatory and high-level operational purposes. Both the permit to mine and material license require additional, mine unit scale aquifer tests to confirm past work and help with future wellfield design.
7.3 Geotechnical Data, Testing, and Analysis
Because no actual excavation of overburden is required for successful ISR operations, no geotechnical work has been completed by URE to further mining operations. The only geotechnical analysis that has been completed was subsidiary to installation of the processing plant and wastewater containment ponds. The results of this study concluded that construction of the processing plant and wastewater containment ponds could proceed, and these facilities have since been constructed.
7.4 Disequilibrium
Uranium values derived from gamma data are termed “radiometric” values and are assumed to be equivalent (eU3O8) to true uranium values if equilibrium is present. In other words, equilibrium exists when the ratio of radiometric eU3O8 to true chemical U3O8 is 1:1. This can be determined by obtaining physical samples of the mineralized formation and conducting laboratory analyses of their uranium content; or by modern logging methods, including Prompt Fission Neutron logging (PFN). The true uranium content thus derived is then compared to the radiometric values in terms of GT on a per-mineralized intercept basis and that ratio is considered the Disequilibrium Factor (DEF) for that uranium intercept.
The uranium content used by URE to develop the mineral resource estimates in Chapter 11.0 has been derived mainly from radiometric geophysical logs (gamma logs) from which the uranium content is interpreted assuming radiometric equilibrium. Justification for this interpretation method is described below.
Disequilibrium in roll front deposits becomes an issue largely because of the possibility of remobilization of uranium during the roll front formation process, or possible dispersion by modern shallow oxidizing groundwater. Each circumstance may lead to separation of uranium from its gamma-emitting daughter products, most significantly bismuth isotope 214 (214Bi), which is the isotope most strongly measured by gamma logging. Since the presence of uranium is traditionally detected using gamma measurements, disequilibrium conditions could result in erroneous estimation of uranium values.
Disequilibrium within the MMT in the Lost Creek Project has been studied extensively. Core of selected mineralized zones from historical drilling and drilling conducted by URE from 2005 through 2010 have been analyzed for chemical uranium on one-foot depth intervals. Detailed comparisons of laboratory results against mineralization values derived from gamma logs have been performed.
| Ur-Energy – Lost Creek ISR Uranium Property Amended Technical Report Summary – September 19, 2022 | Page 52 |
|
|
|
In addition, PFN technology has been available for use in the Lost Creek Project drilling campaigns since 2008. The PFN tool provides a direct down-hole analysis of uranium by means of in-place fission of 235U initiated by the emission of high energy neutrons. Output of the PFN logging is in much the same format as that from the gamma logging tool. Comparison of the mineralization reported by each method has been evaluated in detail on a per-uranium intercept basis. For any given intercept, GT values are derived from both the gamma and PFN data. A DEF is then reported as the ratio of GT values: PFN GT ÷ Gamma GT. Thus, a value greater than 1.0 indicates chemical enrichment compared to gamma, and a value less than 1.0 represents chemical depletion.
Uranium intercepts within virtually all stratigraphic horizons and roll front zones have been spot-tested by PFN-logging. PFN sampling methods are discussed in Chapter 8.1. In the Property, approximately 13 percent of all holes drilled by URE within the Property have been logged using PFN technology.
Detailed evaluation of the core and PFN results indicates that the MMT in the Lost Creek Project as a whole is in equilibrium. A statistical analysis of the data revealed that the deposit exhibits disequilibrium characteristics consistent with a relatively stable roll front deposit, including slight chemical enrichment common in the reduced facies of the Nose and Seepage zones where the vast majority of resource resides. Conversely, a significant depletion is recognized in oxidized facies behind the front. A statistical average of all significant uranium intercepts analyzed with PFN in the MMT yielded an overall positive DEF, or moderately enriched. In spite of this fact, resource estimation methods employed by URE assume equilibrium (or DEF of 1.0) in order to maintain a conservative perspective.
| Ur-Energy – Lost Creek ISR Uranium Property Amended Technical Report Summary – September 19, 2022 | Page 53 |
|
|
|
8.0 SAMPLE COLLECTION, PREPARATION, ANALYSIS AND SECURITY
No mineralization at the Property is found in outcrop, therefore, testing of the mineralization is accomplished solely by drilling. Similarly, virtually all measurement of uranium content, or “sampling,” is accomplished by one or more of three methods derived from the drilling activities:
|
| 1. | Down-Hole Gamma Logs: This method is the most common and provides information on mineralization. Every hole drilled on the Property is gamma logged. Gamma logging is an indirect measurement of uranium content. |
|
|
|
|
|
| 2. | PFN logging of selected mineralized intervals. This method provides a direct downhole measurement of uranium content as a supplement to, and confirmation of, gamma measurements. |
|
|
|
|
|
| 3. | Coring: Only a small percentage of drilled holes are cored. Laboratory analyses of core provide information on uranium content and physical, mineralogical and chemical properties of the host formation. |
8.1 Down-hole Geophysical Logging
Every hole completed on the Property by URE and its predecessors has been geophysically logged using a down-hole electronic probe. URE geophysical logging data have been obtained using a Company owned and operated logging unit that employs technology originally developed by GeoInstruments, Inc. of Nacogdoches, Texas, and also from a qualified independent contractor, Century Geophysical of Tulsa, Oklahoma. Down-hole measurements include gamma logs, single-point resistance, self-potential, and hole deviation.
Quality control on the logging units is performed by calibration of the logging unit at the Casper, Wyoming US Department of Energy (DOE) test pit (known source concentration) no less than once a month. Calibration is performed using industry established procedures. URE maintains detailed calibration records. Logging contractors employed by URE are required to calibrate in the same fashion and on a similar schedule. Additionally, the reliability of URE’s gamma tool has been tested by repeat logging of several holes multiple times; and by duplicate logging of several holes which were also logged by independent contractors.
Gamma logs provide data that is an indirect measurement of uranium content in the host rock. Gamma radiation measurements are collected in one-tenth foot depth intervals. A DOE algorithm is used by the logging unit software to convert the gamma ray readings, measured in counts per second (CPS), into grade reported as equivalent percent uranium (% eU3O8). The results are reported in one-half foot increments. Mineralized intervals (uranium intercepts) are then defined by applying pre-established grade cutoffs, to report:
|
| · | Thickness of each mineralized zone (ft.). Mineralized thickness from gamma logs is considered an accurate representation of the true thickness because the strata are essentially horizontal and drill holes are virtually vertical, |
|
| · | Average Grade within each thickness interval (% eU3O8), |
|
| · | Depth (bgs) to the top of the intercept (ft.), and |
|
| · | GT: Calculated as the average grade multiplied by thickness (%ft.) for each intercept interval (usually expressed without units). |
| Ur-Energy – Lost Creek ISR Uranium Property Amended Technical Report Summary – September 19, 2022 | Page 54 |
|
|
|
PFN Logging: PFN is considered a direct measurement of true uranium concentration (% U3O8) and is used to verify the grades of uranium intercepts previously reported by gamma logging. PFN logging is accomplished by a down-hole probe in much the same manner as gamma logs, however only the mineralized interval plus a buffer interval above and below are logged. After review of the gamma log from each drill hole, the URE field geologists determine if any intercepts warrant PFN logging, based on the GT of the gamma intercepts (GT ≥ 0.10). If selected by the field geologist and if the PFN tool is available within a reasonable time frame, the hole will be logged by PFN. As such, the PFN results are employed only as a confirmation of gamma derived results, but not as a complete replacement or duplication of them. Approximately 13 percent of all holes drilled by URE on the Property have been PFN logged. Quality control for the PFN is performed at the DOE test pit in a manner similar to that described above for the gamma tool.
8.2 Coring
Core samples have been obtained from approximately one percent of the holes drilled by URE at the Property. Core holes are located as close offsets of previously drilled holes, which showed uranium intercepts of interest. Select intervals within holes of interest are cored by means of a mud-rotary drill-rig employing a 15-ft. long, split-tube core barrel. Core recovery has been approximately 95 percent. Core is described in detail and photographed in the field. Additionally, the core is scanned in the field on one-half foot intervals with a hand-held scintillometer to identify sections of higher radioactivity for sampling. The scintillometer results are also employed to provide a detailed depth correlation and comparison between the gamma log and core depths provided by the driller. Depth correlation accuracy of less than one-half foot is normally obtained. The core is then vacuum sealed in plastic bags. Samples selected for laboratory analyses are later cut in one-foot intervals, split by hand longitudinally and bagged by URE employees for shipping. Analysis has been conducted by qualified laboratories for uranium content (discussed below). In addition, selected samples are tested for density, permeability and other physical features, as well as leach amenability. Samples for leach testing are vacuum sealed again immediately after selection and prior to shipping to the lab.
8.3 Drill Cuttings
During drilling of all holes, cuttings are collected at five-foot intervals. Detailed descriptions of each of these samples are then documented by the field geologists. Drill cutting samples are valuable for lithologic evaluation and also for description of redox conditions, based on sample color. However, these samples are not analyzed for uranium content because there is considerable dilution and mixing which occurs as the cuttings are flushed to the surface. In addition, the samples are not definitive with regard to depth due to variation in the lag time between cutting at the drill bit and when the sample is collected at the surface.
8.4 Analyses and Security
After collection and documentation in the field, cores and other physical samples derived from URE’s drilling activities at the Property were delivered to Energy Laboratories, Inc. (Energy Labs), an independent commercial laboratory in Casper, Wyoming which has been accredited by the National Environmental Laboratory Accreditation Council, the NRC, Multi-Agency Radiological Laboratory Analytical Protocols via the USEPA, U.S. Department of Defense, U.S. Geological Survey, U.S. Department of Energy, NRC, U.S. Food and Drug Administration, and the National Institute of Standards and Technology. Energy Labs has been performing uranium analyses and testing for over 30 years, holds numerous certifications from multiple organizations, and is considered by the QP to be qualified to secure, handle and analyze samples in accordance with industry standards. Energy Labs has an industry-standard internal QA/QC system including routine equipment calibration and the use of standards, blanks, duplicates and spikes. Testing of physical properties (porosity, permeability) have also been performed by Maxim Technologies of Billings, Montana and Weatherford Laboratories of Casper, Wyoming (Weatherford, 2010). Hazen Research and Assayers Canada LTD (now SGS) performed analyses of certain duplicate samples. These laboratories are all independent, certified commercial laboratories.
| Ur-Energy – Lost Creek ISR Uranium Property Amended Technical Report Summary – September 19, 2022 | Page 55 |
|
|
|
Data from historical sampling, prior to URE, were derived by reputable exploration companies and are assumed to have been collected, secured, and analyzed in accordance with standard industry practices at the time. More recent data have been validated by calibration of down-hole gamma and PFN comparison against laboratory assay results, as described in the prior Chapter. The calibration confirmed the ability to appropriately use the down-hole data for resource estimate calculations.
8.5 Quality Control Summary
URE maintains quality control procedures associated with its coring program:
|
| · | Scanning the core with a scintillometer to provide a detailed depth correlation and comparison between the gamma log and driller’s core depths, |
|
|
|
|
|
| · | Vacuum sealing core in plastic bags to prevent contamination and oxidation, |
|
|
|
|
|
| · | Completing a Chain of Custody (COC) Record for all core samples sent to laboratories for analyses, |
|
|
|
|
|
| · | Obtaining a signature on the COC Record (along with instructions) from the URE employee who relinquished the samples to the laboratory, |
|
|
|
|
|
| · | Receiving a signed COC Record from the laboratory with the signature of the individual who received the samples, |
|
|
|
|
|
| · | Validation of laboratory quality control procedures which typically include method blanks of low metal concentrations and spikes of known metal concentrations, |
|
|
|
|
|
| · | Evaluation and comparison of results against previous analysis and other projects (outlier test or similar, i.e., “red face check”), and |
|
|
|
|
|
| · | Reference samples and subsequent analysis sent to other laboratories. |
Other quality control procedures included the detailed logging of drill cuttings by URE geologists to gain an understanding of redox conditions within host sandstones and also the consistent calibration of both the in-house gamma logging and PFN logging units at the Casper, Wyoming DOE test pit.
8.6 Opinion on Adequacy
The QP reviewed URE Standard Operating Procedure documents and guidelines and found them to be consistent with industry practice. He is of the opinion that the sampling, analyses, and security relevant to the data used in the present resource estimate have been performed to standard industry practices and are acceptable and appropriate for use in the resource estimate.
| Ur-Energy – Lost Creek ISR Uranium Property Amended Technical Report Summary – September 19, 2022 | Page 56 |
|
|
|
9.0 DATA VERIFICATION
Data supporting this Report come almost exclusively in the form of drill data gained from historical drilling activities by previous operators and those conducted by URE since acquisition of the Property. Quality control of URE drill data has been discussed in Chapter 8.0. The tabulations of uranium intercepts compiled by URE have been confirmed by the QP to be consistent with the original down-hole electric logs and the geophysical operator’s uranium intercept calculations.
URE has verified historical drill data by conducting confirmation drilling and coring in the Lost Creek Project adjacent to selected historical exploration holes with results that validate the historical data. In addition, several historical drill holes have been re-entered and re- logged with the gamma tool for comparison to the initial historical gamma logs. In all cases the repeatability of the data was within approximately 10 percent. Furthermore, uranium intercept data of previous operators in all Projects have been evaluated and selectively checked for accuracy by re-calculation of grade and thickness using standard methods established by the U.S. Atomic Energy Commission (AEC). Review of these data has concluded that the historical uranium intercept data are valid and do not require re-calculation. The QP has compared the historical drill log uranium values to the URE tabulations and confirmed the validity and accuracy of the procedure.
The historical drill data supporting Adjoining Projects are derived from the same large regional historical drill database that covers the Lost Creek Project. That database was a part of the acquisition of NFU Wyoming, LLC in 2005, in which URE acquired the Lost Creek Project. Extensive drilling by URE in the Lost Creek Project over the years has confirmed the validity of the database within that Project, as discussed above. Therefore, it is reasonable to assume that the same historical data, derived from the same operators, are accurate and valid within the Adjoining Projects as well.
In the LC East Project, URE possesses gamma logs for virtually every historical drill hole (approximately 1,063 holes). Uranium data employed in the current LC East resource estimates have been collected from varied historical sources in URE’s data files, mainly 1) historical drill hole maps with uranium intercept values (most abundant source) and 2) grade calculation sheets within drill hole file folders. Where such information was not available, uranium intercept values were calculated from the gamma logs by URE geologists using the standard AEC calculation method mentioned above and employing a grade cutoff of 0.020 percent. In addition, numerous historical uranium intercepts were re-calculated by URE geologists for confirmation of that data. In total, approximately 17 percent of all uranium intercepts within the LC East Project have been calculated by URE geologists. A statistical comparison of URE calculated uranium intercept values to historical uranium intercept values yielded an average variance of 8.6 percent. The QP considers this to be adequate for a precise estimation of resources. Therefore, the current resource estimation remains based largely on historical uranium intercept data supplemented with recent data derived from URE drilling in 2012 and 2015. Where available, the values recently calculated by URE replaced the historical uranium intercept values. URE continues its analyses and recalculation of all uranium intercepts within the LC East Project.
The QP is of the opinion that the quality of the data is acceptable for use in this Report.
| Ur-Energy – Lost Creek ISR Uranium Property Amended Technical Report Summary – September 19, 2022 | Page 57 |
|
|
|
10.0 MINERAL PROCESSING AND METALLURGICAL TESTING
Mineral processing tests were performed on core as early as 1979 by Texasgulf and 1981 by Wyoming Minerals Corporation (see Table 5). These tests, using bicarbonate lixiviant, resulted in extractions ranging up to 81 percent for agitation leach tests and 89 percent for column leach tests. In 2005 and 2007, URE conducted more leach tests on samples from the HJ Horizon, using Energy Labs. The 2005 tests demonstrated an average recovery of 82.8 percent while the 2007 testing concluded that a significant portion of the uranium, about 83 percent, can be leached from the samples. The purpose of these early leach tests was not to predict a percent recovery from planned ISR operations, but rather to demonstrate that the uranium ore was amenable to leaching by bicarbonate lixiviants.
Favorable uranium recoveries to date from production operations in MU1 support the positive pre- mining leach test results. Comparing recoveries against pore volumes circulated, production has exceeded expectations due to head grades averaging significantly higher than the originally forecasted level of 47 mg/l. For example, HH1-1 had a Measured Resource of 172,857 pounds U3O8 under-pattern. As of September 30, 2015, after circulation of 28.6 pore volumes of mining fluid, 164,490 net pounds U3O8 had been recovered. This represents a 95.2 percent recovery. HH1-1 has been operating for the longest period of time and would be expected to have one of the higher recovery factors with MU1. Similarly, HH1-2 has produced 141,070 net pounds U3O8 over 21.7 pore volumes for a 72.0 percent recovery factor and after 23.3 pore volumes HH1-3 has produced 206,288 net pounds U3O8 for a 92.5 percent recovery. The average recovery for the first three HHs in MU1, through September 30, 2015, was 86.5 percent.
To date, all uranium production from MU1 has come from the HJ Horizon. In 2010, URE performed leach testing on samples from the deeper KM Horizon. Seven samples obtained from one-foot sections of core were tested by Energy Labs for mineral recovery. Table 6 presents the combination of lixiviants that were evaluated and are shown with the recovery results after 30 pore volumes, in five pore volume increments. The variables in the lixiviants were bicarbonate concentration and oxidant (peroxide) strength using ambient groundwater, except for one test conducted with laboratory grade water. The individual leach periods were 16 hours each. Twenty-five pore volumes of bicarbonate leach solution were passed through the samples. Uranium recovery ranged from 54.1 to 93.0 percent with an average uranium recovery of 80.6 percent.
Table 6. KM Horizon - Leach Test Results, 2010
| Sample ID |
| Solution Base |
| Bicarbonate (NaHCO3) (g/L) |
|
| Peroxide (H2O2) (g/L) |
|
| U Recovery % |
|
| Average Solution (mg/L U) |
| ||||
| LC46-01 |
| Groundwater |
| Natural Bicarb |
|
|
| 0.25 |
|
|
| 54.1 |
|
|
| 42.0 |
| |
| LC46-02 |
| Groundwater |
|
| 1.0 |
|
|
| 0.25 |
|
|
| 87.2 |
|
|
| 78.8 |
|
| LC46-03 |
| Groundwater |
|
| 1.5 |
|
|
| 0.25 |
|
|
| 87.7 |
|
|
| 84.6 |
|
| LC46-04 |
| Groundwater |
|
| 2.0 |
|
|
| 0.25 |
|
|
| 89.0 |
|
|
| 84.8 |
|
| LC46-05 |
| Groundwater |
|
| 2.0 |
|
|
| 0.50 |
|
|
| 93.0 |
|
|
| 92.6 |
|
| LC46-06 |
| Distilled Water |
|
| 0.5 |
|
|
| 0.50 |
|
|
| 74.0 |
|
|
| 66.3 |
|
| LC46-07 |
| Distilled Water |
|
| 1.0 |
|
|
| 0.50 |
|
|
| 88.0 |
|
|
| 81.0 |
|
The results of these KM tests are similar to those performed on earlier HJ samples and demonstrate the likely continued amenability to in situ recovery of mineralized zones within the Battle Spring Formation for the entire Property.
The QP considers the metallurgical and physical test work and results to date to be adequate to support general process design and selection. Pump testing and core analysis demonstrates that the aquifers have sufficient porosity, permeability and transmissivity to support ISR operations. Equilibrium testing demonstrates that, in general, positive equilibrium exists which indicates that uranium is present where gamma data suggest it is present and at the grade indicated by the probe data. Laboratory leach testing demonstrates that the uranium can be solubilized using a carbonate and oxygen based lixiviant. Successful ISR mining activities observed thus far at the Property further demonstrate amenability to ISR mining.
| Ur-Energy – Lost Creek ISR Uranium Property Amended Technical Report Summary – September 19, 2022 | Page 58 |
|
|
|
11.0 MINERAL RESOURCE ESTIMATES
The mineral resources for the Property reported here have been estimated utilizing the GT contour method. The GT contour method is well accepted within the uranium ISR industry and is suited to guide detailed mine planning and estimates of recoverable resources for roll front type deposits such as the Property. A discussion of the methodology is presented below.
Resource estimation for the Property does not include mineralization above the static water table as such mineralization is not amenable to in-situ recovery.
11.1 Assumptions
Resources within the Property are identified recognizing that roll front mineralization occurs in long, narrow, sinuous bodies, which are found adjacent and parallel to alteration (redox) fronts. These commonly occur in multiple, vertically stacked horizons, each of which represents a unique resource entity. Resource classification requires horizontal continuity within individual horizons. Accumulation of resources in a vertical sense (i.e., accumulating multiple intercepts per drill hole) is not valid in ISR applications. Individual roll fronts within mineralized horizons are assumed to be 50 ft. wide (based on project experience) unless sufficient information is available to establish otherwise.
In addition, certain assumptions were incorporated throughout all calculations:
|
| 1. | No disequilibrium. Therefore, the DEF is 1.0. |
|
| 2. | The unit density of mineralized rock is 16.6 cubic ft. per ton, based on numerous core density measurement results (Maxim Technologies Inc. / Tetra Tech, Inc., 2005a, 2005b, 2006). |
|
| 3. | All geophysical logs are assumed to be calibrated per normal accepted protocols, and grade calculations are accurate. |
|
| 4. | All mineralization classified as a resource occurs below the static water table. |
11.2 Mineral Resource Estimates
All resource calculations provided are based on accurate drill hole data and use the correct methods to calculate total pounds. Using a GT cutoff of 0.20 mineral resources were classified as Measured, Indicated, and Inferred based on drill spacing. Only areas with mineralized drill holes within 100 feet of each other and on the same horizon were classified as Measured, those within 200 feet of each other were classified as Indicated and those within 400 feet were Inferred. All relevant data were used in the calculation of this uranium resource. The review, validation and updating of the mineral resource estimate, was supervised by the Qualified Person.
Through December 31, 2021, 2.735 million pounds of U3O8 have been captured within the plant at the Lost Creek Project since mining operations commenced. This production has come from Measured Resources from the HJ Horizon. Table 7 illustrates the impact of this production on Lost Creek Project resources.
| Ur-Energy – Lost Creek ISR Uranium Property Amended Technical Report Summary – September 19, 2022 | Page 59 |
|
|
|
11.2.1 Cutoff Selection
Throughout the history of the Property, various minimum grade cutoffs have been applied to define uranium intercepts for resource estimation. Historical activities targeted resources for conventional mining techniques and generally used a 0.030 percent or 0.025 percent grade cutoff. Earlier URE resource estimates also used a 0.030 percent cutoff. However, resource estimates beginning with the NI 43-101 compliant March 2011 Lost Creek Property PEA (TREC, 2011) have employed uranium intercepts reported at the 0.020 percent grade cutoff, recognizing that ISR mining is much less sensitive to grade than conventional mining. The cutoffs used in this Report are typical of ISR industry practice and represent appropriate values relative to current ISR operations. Experience at other ISR operations has demonstrated that grades below 0.020 percent can technologically be successfully leached and recovered, given supporting economics. Due to the nature of roll front deposits and production well designs, the incremental cost of addressing low grades is minimal (given the presence of higher grades).
More than eight years of ISR production at the Lost Creek Project has provided URE a unique insight into the uranium roll front deposits of the Property. Uranium recovery in MU1 has been noteworthy. As described in the June 2015 Technical Report for the Property prepared pursuant to NI 43-101, in order to reconcile higher-than-expected uranium recoveries from production operations in MU1, the GT cutoff for uranium intercepts used in resource estimation was lowered from 0.30 to 0.20. Mining fluids have obviously been contacting and taking into solution some of this lower GT material and lowering the cutoff grade to 0.20 GT better represents the in-situ uranium resources.
In summary, mineralization reportable as resources must be below the static water level and meet the following cutoff criteria:
Minimum Grade: 0.020 percent eU3O8. Grade measured below this cutoff is considered as zero value.
Minimum GT (Grade x Thickness): 0.20 GT. Intercepts with GT values below this cutoff are mapped exterior to the GT contours employed for resource estimation, given zero resource value and therefore are excluded from reported resources.
Minimum Thickness: No minimum thickness is applied but is inherent within the definition of GT (Grade Thickness).
Based on the depths of mineralization, average grade, thickness, GT, and selected cutoffs, it is the QP’s opinion that the mineral resources at the Property have a reasonable prospect of economic extraction by ISR methods using a variable long-term price ranging from $50.80 to $66.04 per pound. The sale price for the produced uranium is assumed to vary based on an annual average of the projections prepared by VIII Capital Corp., November 4, 2021; Cantor Fitzgerald Canada Corporation, October 18, 2021; H.C. Wainwright & Co., September 29, 2021; and UxC, LLC, December 6, 2021 (See Chapter 16).
11.2.2 Resource Classification
Resource estimates were prepared using parameters relevant to the proposed mining of the deposit by ISR methods. The methodology relies on detailed mapping of uranium mineralization to establish continuity of intercepts within individual sandstone host units.
| Ur-Energy – Lost Creek ISR Uranium Property Amended Technical Report Summary – September 19, 2022 | Page 60 |
|
|
|
URE employs a conservative resource classification system that is consistent with professional standards. Mineral resources are identified as Measured, Indicated and Inferred based ultimately on the density of drill hole spacing, both historical and recent; and continuity of mineralization within the same mineralized horizon (roll front).
In simplest terms, to conform to each classification, resources determined using the GT contour method must meet the following criteria:
|
| 1. | Meet the 0.02 percent grade cutoff, |
|
| 2. | Occur within a single, discrete mineralized horizon (roll front), |
|
| 3. | Fall within the 0.20 GT contour, and |
|
| 4. | Extend no farther from the drill hole than the radius of influence specified below for each category. |
Employing these considerations, mineralization that meets the above criteria is classified as a resource and assigned a level of confidence via the following drill spacing guidelines:
Measured:
≤100 ft. (i.e., mineralization on trend, within the 0.20 GT contour, and which does not extend beyond 100 ft. from any given drill hole with a uranium intercept ≥ to the minimum GT cutoff).
Indicated:
100 – 200 ft. (i.e., mineralization on trend, within the 0.20 GT contour, and which extends from 100 ft. to 200 ft. from any given drill hole with a uranium intercept ≥ to the minimum GT cutoff).
Inferred:
200 – 400 ft. (i.e., mineralization on trend, within the 0.20 GT contour, and which extends from 200 ft. to 400 ft. from any given drill hole with a uranium intercept ≥ to the minimum GT cutoff).
Isolated occurrences of mineralization meeting the GT cutoff criteria (i.e., single isolated mineralized drill holes) are classified as Inferred, and are defined as mineralization which occurs within the qualifying GT contour for the given uranium horizon and extending no more than 400 ft. beyond the sample point (drill hole).
11.2.3 Methodology
11.2.3.1 Fundamentals
The Property resources are defined by utilizing both historical and recent drilling information. The basic unit of uranium mineralization is the mineral intercept and the basic unit of a uranium resource is the mineralized horizon, which is generally synonymous to a roll front. Mineral intercepts are assigned to named mineralized horizons based on geological interpretation by URE geologists founded on knowledge of stratigraphy, redox, and roll front geometry and zonation characteristics. Resources are derived and reported per mineralized horizon (i.e., per roll front). In any given geographic area, an accumulation of resources in a particular mineralized horizon may be combined into a resource area.
| Ur-Energy – Lost Creek ISR Uranium Property Amended Technical Report Summary – September 19, 2022 | Page 61 |
|
|
|
11.2.3.2 Mineral Intercepts
Mineral intercepts are derived from drill hole gamma logs and represent where the drill hole has intersected a mineralized zone. Calculation of the uranium content detected by gamma logs is traditionally reported in terms of uranium grade as eU3O8% (equivalent uranium) on one-half foot depth increments. A uranium intercept is defined as a continuous thickness interval in which uranium concentration meets or exceeds the grade cutoff value, which is 0.020 eU3O8% for the Property. Mineralization below the cutoff grade is treated as zero value with regard to resource estimation. A uranium intercept is defined in terms of:
|
| · | Thickness of the mineralized interval that meets cutoff criteria |
|
|
|
|
|
| · | Average Grade of uranium within that interval |
|
|
|
|
|
| · | Depth (bgs) to the top of that interval |
In addition, a GT value is assigned to each uranium intercept, defined as the average grade of the intercept times the thickness of the intercept. GT is a convenient and functional single term used to represent the overall quality of the uranium intercept. It is employed as the basic criterion to characterize uranium intercepts for use in the resource estimation process, which at the Property has been redefined as GT ≥ 0.20. Intercepts, with GTs < 0.20, are excluded from the resource calculation, but may be taken into consideration when drawing GT contours.
Each uranium intercept is assigned to a stratigraphic and mineralized horizon by means of geological evaluation. The primary criterion employed in assignment of uranium intercepts to mineralized horizons is roll front correlation. Depth and elevation of intercepts are secondary criteria that support correlation. The evaluation also involves interpretation of roll front zonation (position within the roll front) by means of gamma curve signature, redox state, lithology and relative uranium content (Figure 10). Uranium intercept data and associated interpretations are stored in a drill hole database inventoried per drill hole and mineralized horizon. Using geographic information system (GIS) software, this database is employed to generate map plots displaying GT values and interpretive data for each mineralized horizon of interest. These maps become the basis for GT contouring as described below.
11.2.3.3 GT Contouring and Resource Estimation
For the map plots of GT values mentioned above, the GT contour lines are drafted honoring all GT values. Contours may be carefully modified by URE geologists where justified to reflect knowledge of roll front geology and geometry. The GT contour maps thus generated for each mineralized horizon form the foundation for resource calculation. In terms of geometry, the final product of a GT contoured mineralized horizon typically represents a mineralized body that is long, narrow, sinuous, and which closely parallels the redox front boundary. Parameters employed to characterize the mineralized body are:
|
| Thickness: | Average thickness of uranium intercepts assigned to the mineralized horizon (inherent in GT values) |
|
|
|
|
|
| Grade: | Average grade of uranium intercepts assigned to the mineralized horizon (inherent in GT values) |
|
|
|
|
|
| Depth: | Average depth of uranium intercepts assigned to the mineralized horizon |
| Ur-Energy – Lost Creek ISR Uranium Property Amended Technical Report Summary – September 19, 2022 | Page 62 |
|
|
|
|
| Area: | Defined as the area interior to the 0.20 GT contour lines, more specifically: |
|
| Width: | Defined by the breadth of the 0.20 GT contour boundaries. Where sufficient data are unavailable, (i.e., wide-spaced drilling), the width is assumed to be no greater than 50 ft. |
|
|
|
|
|
| Length: | Defined by the endpoints of the 0.20 GT contour boundaries. Where sufficient data is unavailable, length is limited to 800 ft. (i.e., 400 ft. on either side of an isolated drill hole – Inferred resource category). |
For resource estimation, the area of a mineral horizon is further partitioned into banded intervals between GT contours, to which the mean GT of the given contour interval is applied. Area values for each contour interval are then determined by GIS software and resources are then calculated for each contour interval employing the following equation.
POUNDS = AREA x GT x 20 x DEF
TF
|
| Where: |
|
|
|
|
|
|
| POUNDS | = Resources (lbs.) |
|
|
|
|
|
| AREA | = Area measured within any given GT contour interval (ft.2) |
|
|
|
|
|
| GT | = Mean GT within any given contour interval (%-ft.) |
|
|
|
|
|
| 20 | = Conversion constant: grade percent and tons to unit lbs. (1% of a ton) |
|
|
|
|
|
| DEF | = Disequilibrium factor (=1.0, no disequilibrium) |
|
|
|
|
|
| TF | = Tonnage Factor: Rock density, a constant (=16.6 ft.3/ton). (Enables conversion from volume to weight) |
In map-view, resources for any given mineralized horizon often occur in multiple ‘pods’ rather than a single continuous body. Individual pods are then compiled per mineralized horizon, summed and categorized by level of confidence (Measured, Indicated, or Inferred) using the criteria discussed previously. The resource calculation process is streamlined using the same GIS software in which the mapping and GT contouring took place. Figure 11 is an example of a GT Contoured Resource Polygon generated by URE geologists for an individual mineralized pod. This resource was developed in the MHJ2 Sub Horizon within RA7 (LC East Project). This figure illustrates how GT contour mapping (based on a 0.20 GT cut-off) can delineate a continuous mineral resource where mapped in conjunction with the oxidation/reduction boundary.
| Ur-Energy – Lost Creek ISR Uranium Property Amended Technical Report Summary – September 19, 2022 | Page 63 |
|
|
|
Figure 11. GT Contour Resource Polygon
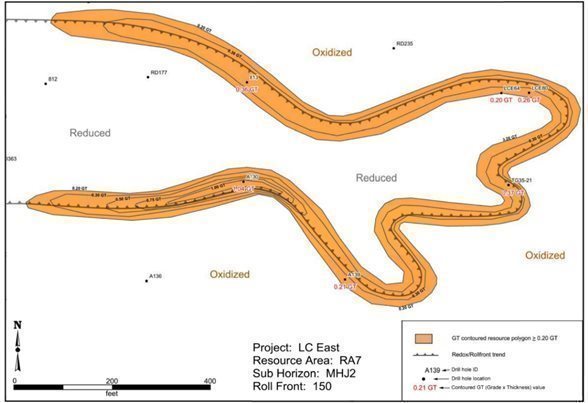
11.2.4 Summary of Resources
Mineral resources are summarized in Table 1 and in Table 7 where they are listed by project and resource horizon. Figure 9 illustrates the location of resources as defined by outlines of the 0.20 GT contour mineralized ‘pods’ and trends for the Property. The current mineral resource estimate for the Property is 11.914 million pounds in the Measured and Indicated categories (after adjustment for MU1 and MU2 production) with an additional 6.607 million pounds in the Inferred category.
There are numerous reasons mineralization was interpreted as Measured Resources at the Property. First, drill spacing used to categorize the Measured Resource category is less than or equal to the well spacing in a 5-spot production pattern (100 ft. spacing from injector to injector) which enabled a detailed wellfield design to be completed. Second, as shown on the geologic cross sections (Figures 8a & 8b) the sub-surface geology at the Property is well known with correlatable aquifers, consistent host sandstone intervals and reliable aquitards across the Property. Third, the roll front deposit model has been studied extensively and is well known geologically. Finally, the Property is in operation and has a history of producing uranium from areas that have been classified as Measured Resources which verifies the drill spacing and cutoff criteria used in the resource estimation. This combination of drillhole spacing, well known subsurface geology, well understood deposit model, and history of production at the Property lead WWC to conclude the mineralization in areas with drillhole spacing of less than or equal to 100 ft. fit the definition for Measured Resources.
| Ur-Energy – Lost Creek ISR Uranium Property Amended Technical Report Summary – September 19, 2022 | Page 64 |
|
|
|
Table 7. Lost Creek Property Resources, by Project
|
|
| MEASURED |
|
| INDICATED |
|
| INFERRED |
| |||||||||||||||||||||||||||
| HORIZON | AVG GRADE % eU3O8 |
|
| SHORT TONS (X 1,000) |
|
| POUNDS (X 1,000) |
|
| AVG GRADE % eU3O8 |
|
| SHORT TONS (X 1,000) |
|
| POUNDS (X 1,000) |
|
| AVG GRADE % eU3O8 |
|
| SHORT TONS (X 1000) |
|
| POUNDS (X 1000) |
| ||||||||||
|
|
| |||||||||||||||||||||||||||||||||||
| LOST CREEK PROJECT |
| |||||||||||||||||||||||||||||||||||
| FG Horizon |
|
| 0.047 |
|
|
| 1,525 |
|
|
| 1,449 |
|
|
| 0.049 |
|
|
| 268 |
|
|
| 265 |
|
|
| 0.039 |
|
|
| 200 |
|
|
| 156 |
|
| HJ Horizon |
|
| 0.048 |
|
|
| 6,412 |
|
|
| 6,129 |
|
|
| 0.050 |
|
|
| 2,174 |
|
|
| 2,152 |
|
|
| 0.044 |
|
|
| 1,795 |
|
|
| 1,584 |
|
| HJ Production Through 09/30/2015 |
|
| 0.048 |
|
|
| -2,849 |
|
|
| -2,735 |
|
|
|
|
|
|
|
|
|
|
|
|
|
|
|
|
|
|
|
|
|
|
|
|
|
| Total HJ - Post Production |
|
| 0.048 |
|
|
| 3,563 |
|
|
| 3,394 |
|
|
|
|
|
|
|
|
|
|
|
|
|
|
|
|
|
|
|
|
|
|
|
|
|
| KM Horizon |
|
| 0.047 |
|
|
| 635 |
|
|
| 595 |
|
|
| 0.045 |
|
|
| 970 |
|
|
| 878 |
|
|
| 0.052 |
|
|
| 1,023 |
|
|
| 1,054 |
|
| L Horizon |
| — |
|
| — |
|
| — |
|
| — |
|
| — |
|
| — |
|
| — |
|
| — |
|
| — |
| |||||||||
| M Horizon |
| — |
|
| — |
|
| — |
|
| — |
|
| — |
|
| — |
|
|
| 0.042 |
|
|
| 221 |
|
|
| 186 |
| ||||||
| N Horizon |
| — |
|
| — |
|
| — |
|
| — |
|
| — |
|
| — |
|
|
| 0.077 |
|
|
| 22 |
|
|
| 33 |
| ||||||
| Total - LOST CREEK |
|
| 0.048 |
|
|
| 5,723 |
|
|
| 5,438 |
|
|
| 0.048 |
|
|
| 3,412 |
|
|
| 3,295 |
|
|
| 0.046 |
|
|
| 3,261 |
|
|
| 3,013 |
|
| MEASURED + INDICATED = |
|
|
| 9,135 |
|
|
| 8,733 |
|
|
|
|
|
|
|
|
|
|
|
|
| |||||||||||||||
| LC EAST PROJECT |
| |||||||||||||||||||||||||||||||||||
| FG Horizon |
|
| 0.116 |
|
|
| 37 |
|
|
| 86 |
|
|
| 0.055 |
|
|
| 179 |
|
|
| 199 |
|
|
| 0.042 |
|
|
| 526 |
|
|
| 444 |
|
| HJ Horizon |
|
| 0.051 |
|
|
| 1,067 |
|
|
| 1,081 |
|
|
| 0.040 |
|
|
| 1,086 |
|
|
| 865 |
|
|
| 0.043 |
|
|
| 1,231 |
|
|
| 1,050 |
|
| KM Horizon |
|
| 0.049 |
|
|
| 288 |
|
|
| 282 |
|
|
| 0.041 |
|
|
| 594 |
|
|
| 481 |
|
|
| 0.041 |
|
|
| 1,168 |
|
|
| 967 |
|
| L Horizon |
|
| — |
|
|
| — |
|
|
| — |
|
|
| 0.029 |
|
|
| 24 |
|
|
| 14 |
|
|
| 0.029 |
|
|
| 9 |
|
|
| 5 |
|
| M Horizon |
|
| — |
|
|
| — |
|
|
| — |
|
|
| 0.046 |
|
|
| 9 |
|
|
| 8 |
|
|
| 0.044 |
|
|
| 20 |
|
|
| 18 |
|
| N Horizon |
|
| — |
|
|
| — |
|
|
| — |
|
|
| — |
|
|
| — |
|
|
| — |
|
|
| — |
|
|
| — |
|
|
| — |
|
| Total – LC EAST |
|
| 0.052 |
|
|
| 1,392 |
|
|
| 1,449 |
|
|
| 0.041 |
|
|
| 1,891 |
|
|
| 1,567 |
|
|
| 0.042 |
|
|
| 2,954 |
|
|
| 2,484 |
|
| MEASURED + INDICATED = |
|
|
| 3,283 |
|
|
| 3,016 |
|
|
|
|
|
|
|
|
|
|
|
|
| |||||||||||||||
| LC NORTH PROJECT |
| |||||||||||||||||||||||||||||||||||
| FG Horizon |
|
| — |
|
|
| — |
|
|
| — |
|
|
| — |
|
|
| — |
|
|
| — |
|
|
| — |
|
|
| — |
|
|
| — |
|
| HJ Horizon |
|
| — |
|
|
| — |
|
|
| — |
|
|
| — |
|
|
| — |
|
|
| — |
|
|
| 0.045 |
|
|
| 216 |
|
|
| 193 |
|
| KM Horizon |
|
| — |
|
|
| — |
|
|
| — |
|
|
| — |
|
|
| — |
|
|
| — |
|
|
| 0.052 |
|
|
| 174 |
|
|
| 180 |
|
| L Horizon |
|
| — |
|
|
| — |
|
|
| — |
|
|
| — |
|
|
| — |
|
|
| — |
|
|
| 0.032 |
|
|
| 163 |
|
|
| 104 |
|
| M Horizon |
|
| — |
|
|
| — |
|
|
| — |
|
|
| — |
|
|
| — |
|
|
| — |
|
|
| 0.061 |
|
|
| 77 |
|
|
| 94 |
|
| N Horizon |
|
| — |
|
|
| — |
|
|
| — |
|
|
| — |
|
|
| — |
|
|
| — |
|
|
| 0.031 |
|
|
| 14 |
|
|
| 9 |
|
| Total - LC NORTH |
|
| 0 |
|
|
| 0 |
|
|
| 0 |
|
|
| 0 |
|
|
| 0 |
|
|
| 0 |
|
|
| 0.045 |
|
|
| 644 |
|
|
| 580 |
|
| LC SOUTH PROJECT |
| |||||||||||||||||||||||||||||||||||
| FG Horizon |
|
| — |
|
|
| — |
|
|
| — |
|
|
| 0.054 |
|
|
| 73 |
|
|
| 80 |
|
|
| 0.046 |
|
|
| 332 |
|
|
| 304 |
|
| HJ Horizon |
|
| — |
|
|
| — |
|
|
| — |
|
|
| 0.029 |
|
|
| 147 |
|
|
| 85 |
|
|
| 0.031 |
|
|
| 251 |
|
|
| 154 |
|
| KM Horizon |
|
| — |
|
|
| — |
|
|
| — |
|
|
| — |
|
|
| — |
|
|
| — |
|
|
| 0.036 |
|
|
| 54 |
|
|
| 38 |
|
| L Horizon |
|
| — |
|
|
| — |
|
|
| — |
|
|
| — |
|
|
| — |
|
|
| — |
|
|
| — |
|
|
| — |
|
|
| — |
|
| M Horizon |
|
| — |
|
|
| — |
|
|
| — |
|
|
| — |
|
|
| — |
|
|
| — |
|
|
| — |
|
|
| — |
|
|
| — |
|
| N Horizon |
|
| — |
|
|
| — |
|
|
| — |
|
|
| — |
|
|
| — |
|
|
| — |
|
|
| — |
|
|
| — |
|
|
| — |
|
| Total - LC SOUTH |
|
| 0 |
|
|
| 0 |
|
|
| 0 |
|
|
| 0.037 |
|
|
| 220 |
|
|
| 165 |
|
|
| 0.039 |
|
|
| 637 |
|
|
| 496 |
|
| LC WEST PROJECT |
| |||||||||||||||||||||||||||||||||||
| FG Horizon |
|
| — |
|
|
| — |
|
|
| — |
|
|
| — |
|
|
| — |
|
|
| — |
|
|
| — |
|
|
| — |
|
|
| — |
|
| HJ Horizon |
|
| — |
|
|
| — |
|
|
| — |
|
|
| — |
|
|
| — |
|
|
| — |
|
|
| — |
|
|
| — |
|
|
| — |
|
| KM Horizon |
|
| — |
|
|
| — |
|
|
| — |
|
|
| — |
|
|
| — |
|
|
| — |
|
|
| 0.109 |
|
|
| 16 |
|
|
| 34 |
|
| L Horizon |
|
| — |
|
|
| — |
|
|
| — |
|
|
| — |
|
|
| — |
|
|
| — |
|
|
| — |
|
|
| — |
|
|
| — |
|
| M Horizon |
|
| — |
|
|
| — |
|
|
| — |
|
|
| — |
|
|
| — |
|
|
| — |
|
|
| — |
|
|
| — |
|
|
| — |
|
| N Horizon |
|
| — |
|
|
| — |
|
|
| — |
|
|
| — |
|
|
| — |
|
|
| — |
|
|
| — |
|
|
| — |
|
|
| — |
|
| Total - LC WEST |
|
| 0 |
|
|
| 0 |
|
|
| 0 |
|
|
| 0 |
|
|
| 0 |
|
|
| 0 |
|
|
| 0.109 |
|
|
| 16 |
|
|
| 34 |
|
(Continued on next page)
| Ur-Energy – Lost Creek ISR Uranium Property Amended Technical Report Summary – September 19, 2022 | Page 65 |
|
|
|
Table 7. Lost Creek Property Resources, by Project (continued)
SUMMARY
|
|
| MEASURED |
|
| INDICATED |
|
| INFERRED |
| |||||||||||||||||||||||||||
|
|
| AVG GRADE % |
|
| SHORT TONS |
|
| POUNDS |
|
| AVG GRADE % |
|
| SHORT TONS |
|
| POUNDS |
|
| AVG GRADE |
|
| SHORT TONS |
|
| POUNDS |
| |||||||||
| PROJECT |
| eU3O8 |
|
| (X 1000) |
|
| (X 1000) |
|
| eU3O8 |
|
| (X 1000) |
|
| (X 1000) |
|
| % eU3O8 |
|
| (X 1000) |
|
| (X 1000) |
| |||||||||
| LOST CREEK |
|
| 0.048 |
|
|
| 5,723 |
|
|
| 5,438 |
|
|
| 0.048 |
|
|
| 3,412 |
|
|
| 3,295 |
|
|
| 0.046 |
|
|
| 3,261 |
|
|
| 3,013 |
|
| LC EAST |
|
| 0.052 |
|
|
| 1,392 |
|
|
| 1,449 |
|
|
| 0.041 |
|
|
| 1,891 |
|
|
| 1,567 |
|
|
| 0.042 |
|
|
| 2,954 |
|
|
| 2,484 |
|
| LC NORTH |
|
| — |
|
|
| — |
|
|
| — |
|
|
| — |
|
|
| — |
|
|
| — |
|
|
| 0.045 |
|
|
| 644 |
|
|
| 580 |
|
| LC SOUTH |
|
| — |
|
|
| — |
|
|
| — |
|
|
| 0.037 |
|
|
| 220 |
|
|
| 165 |
|
|
| 0.039 |
|
|
| 637 |
|
|
| 496 |
|
| LC WEST |
|
| — |
|
|
| — |
|
|
| — |
|
|
| — |
|
|
| — |
|
|
| — |
|
|
| 0.109 |
|
|
| 16 |
|
|
| 34 |
|
| EN |
|
| — |
|
|
| — |
|
|
| — |
|
|
| — |
|
|
| — |
|
|
| — |
|
|
| — |
|
|
| — |
|
|
| — |
|
| GRAND TOTAL |
|
| 0.048 |
|
|
| 7,115 |
|
|
| 6,887 |
|
|
| 0.046 |
|
|
| 5,523 |
|
|
| 5,027 |
|
|
| 0.044 |
|
|
| 7,512 |
|
|
| 6,607 |
|
| MEASURED + INDICATED = |
|
|
|
|
|
|
|
|
|
|
|
|
|
|
|
|
|
|
|
|
| |||||||||||||||
Notes
|
| 1 | Sum of Measured and Indicated tons and pounds may not add to the reported total due to rounding. |
|
| 2 | % eU3O8 is a measure of gamma intensity from a decay product of uranium and is not a direct measurement of uranium. Numerous comparisons of eU3O8 and chemical assays of Lost Creek rock samples, as well as PFN logging, indicate that eU3O8 is a reasonable indicator of the chemical concentration of uranium. |
|
| 3 | Table shows resources based on grade cutoff of 0.02 % eU3O8 and a GT cutoff of 0.20. |
|
| 4 | Measured, Indicated, and Inferred Mineral Resources as defined in 17 CFR § 229.1300. |
|
| 5 | Resources are reported through December 31, 2021. |
|
| 6 | All reported resources occur below the static water table. |
|
| 7 | 2.735 million lbs. of U3O8 have been produced from the HJ Horizon in the Lost Creek Project as of December 31, 2021. |
|
| 8 | Mineral resources that are not mineral reserves do not have demonstrated economic viability. |
|
| 9 | The point of reference for resources is in situ at the Property. |
11.2.5 Resource Estimation Auditing
The resource estimate detailed herein was evaluated for quality control and assurance using the following methods.
|
| 1. | Random historical log files were examined in detail to confirm gamma interpretations as well as grade calculations. |
|
|
|
|
|
| 2. | Multiple historical logs were reviewed to confirm geologic and grade continuity. |
|
|
|
|
|
| 3. | Drilling density as depicted on maps and observed in the field was evaluated to demonstrate that the uranium mineralization at the Property was consistent with resource definitions. |
|
|
|
|
|
| 4. | Gamma and PFN probe calibration logs were reviewed. |
|
|
|
|
|
| 5. | Detailed examination of significant resource bearing roll front systems was conducted in collaboration with URE geologists to confirm log interpretations, continuity of mineralization and nature of GT contour development. |
|
|
|
|
|
| 6. | Random mineralized pods within the resource model were evaluated to confirm the area assigned to the particular GT contour. |
|
|
|
|
|
| 7. | Resource classification methods and results were reviewed against standard industry practices for at least 25 pods of mineralization. |
In summary, the QP accepts URE interpretations as having been properly done and as reasonable representations of the mineral present. These interpretations provide a reasonable basis for the calculation of uranium mineral resources at the Property.
| Ur-Energy – Lost Creek ISR Uranium Property Amended Technical Report Summary – September 19, 2022 | Page 66 |
|
|
|
11.2.6 Mineral Resource Estimate Risk
To the extent known, the QP is unaware of any current environmental, permitting, legal, title, taxation, socio-economic, marketing, or political factor which could materially affect the accessibility of estimated resources. Risks regarding the recovery of resources are addressed in Chapter 22.2.
Future potential legal risks to the accessibility of the estimated resource may include changes in the designation of the greater sage-grouse as an endangered species by the USFWS because the Property lies within a greater sage-grouse core area as defined by the state of Wyoming. In September 2015, the USFWS issued its finding that the greater sage-grouse does not warrant protection under the Endangered Species Act (ESA). The USFWS reached this determination after evaluating the species’ population status, along with the collective efforts by the BLM and U.S. Forest Service, state agencies, private landowners and other partners to conserve its habitat. After a thorough analysis of the best available scientific information and taking into account ongoing key conservation efforts and their projected benefits, the USFWS determined the species does not face the risk of extinction now or in the foreseeable future and therefore does not need protection under the ESA. Should future decisions vary, or state or federal agencies alter their management of the species, there could potentially be an impact on future expansion operations. However, URE continues to work closely with the WGFD and the BLM to mitigate impacts to the greater sage-grouse.
As is typical for mineral resource estimates, there is risk of improper interpretation of geological data such as grade or continuity. Improper geological data interpretation could impact the estimated resource estimate, either positively or negatively. URE has expended considerable effort to ensure the accuracy and validity of drilling and mineralized data used as the foundation of the resource estimates, as discussed in Chapters 6.0 (Geological Setting and Mineralization), 8.0 (Sample Collection, Preparation, Analysis and Security) and 9.0 (Data Verification). Additionally, geologists contributing to this Report are thoroughly trained and experienced in understanding the nature of roll front uranium deposits to ensure realistic and accurate interpretations of the extent of mineralization.
The mining industry is subject to extensive environmental and other laws and regulations, which may change at any time. Environmental legislation and regulation are evolving in a manner which is resulting in stricter standards and enforcement, increased fines and penalties for non- compliance, more stringent environmental assessments of proposed projects and a heightened degree of responsibility for companies and their officers, directors and employees. In addition to the ESA listing decision made, other rulemakings and proposed legislation are ongoing and may be anticipated from time to time. EPA rulemakings related to tailings facilities and holding ponds, which may also have an impact on ISR projects, including Lost Creek, are proposed from time to time. These are not the only laws and regulations which are under consideration and propose more restrictive changes
| Ur-Energy – Lost Creek ISR Uranium Property Amended Technical Report Summary – September 19, 2022 | Page 67 |
|
|
|
12.0 MINERAL RESERVE ESTIMATES
Mineral reserves were not estimated for this Report.
13.0 MINING METHODS
13.1 Mineral Deposit Amenability
URE is using ISR at the Property. ISR is employed because this technique allows for the low cost and effective recovery of roll front mineralization. An additional benefit is that ISR is relatively environmentally benign when compared to conventional open pit or underground recovery techniques. ISR does not require the installation of tailings facilities or significant surface disturbance.
This mining method utilizes injection wells to introduce a mining solution, called lixiviant, into the mineralized zone. The lixiviant is made of natural groundwater fortified with oxygen as an oxidizer, sodium bicarbonate as a complexing agent, and carbon dioxide for pH control. An alternative for lixiviant makeup is the omission of sodium bicarbonate while increasing the quantity of carbon dioxide. This version allows for the generation of natural sodium bicarbonate from the formation. The oxidizer converts the uranium compounds from a relatively insoluble +4 valance state to a soluble +6 valance state. The complexing agent bonds with the uranium to form uranyl carbonate which is highly soluble. The dissolved uranyl carbonate is then recovered through a series of production wells and piped to a processing plant where the uranyl carbonate is removed from the solution using IX. The groundwater is re-fortified with the oxidizer and complexing agent and sent back to the wellfield to recover additional uranium.
In order to use ISR, the mineralized body must be: saturated with groundwater; transmissive to water flow; and amenable to dissolution by an acceptable lixiviant. While not a requirement, it is beneficial if the production zone aquifer is relatively confined by overlying and underlying aquitards so it is easier to maintain control of the mining lixiviant. 290 monitor and pump-test wells have been completed within the Lost Creek Project (Table 4) in the various horizons to determine the elevation of the water tables. The natural hydrostatic pressure within each horizon causes the water table to rise in the well casing to approximately 170 to 200 ft. bgs. All horizons deeper than the DE are completely saturated at the Lost Creek Project.
URE has been collecting lithologic, water level, and pump test data as part of its ongoing evaluation of hydrologic conditions at the Lost Creek Project. In addition to URE’s data collection, historical hydrogeological data collected for Texasgulf (Hydro-Search, Inc., 1982) were used to support this hydrologic evaluation. Water level measurements, both historical and recent, provide data to assess potentiometric surfaces, hydraulic gradients and inferred groundwater flow directions for the aquifers of interest at the Property.
13.2 Mine Development
To aid in systematic development of resources, URE has designated several RAs within the Property which represent the accumulation of resources within a given horizon in a specific geographical area (Figure 12). Economic analyses in this Report are performed solely on these designated areas, due to the vertical and lateral continuity of the resources. In a general sense they are precursors to production wellfields, which may be derived from all or part of a RA. At the current time, approximately 85 percent of the total Property resources, as presented in Table 7, are contained within RAs.
| Ur-Energy – Lost Creek ISR Uranium Property Amended Technical Report Summary – September 19, 2022 | Page 68 |
|
|
|
An RA is converted to a mine unit if the perimeter monitor ring for the mine unit is defined. (Note, however, that the number sequence of RAs may not coincide with the number sequence of proposed mine units.) Currently there are 12 RAs in the Property. RAs 1 to 6 and 12 lie within the Lost Creek Project. RAs 7 to 11 lie within the LC East Project. RAs commonly overlap where resources in both the HJ and KM Horizons are targeted for potential production. RAs 1 and 2 have been converted to MU1 and MU2, respectively.
The Lost Creek plant is designed to generate approximately 0.9 to 1.0 million pounds of production per year for several years. At full projected flow capacity and at an average uranium content of the lixiviant of 40 mg/L the originally calculated output would be approximately one million pounds annually. Contents in excess of 40 mg/L U will allow for reduced flowrates. Lower uranium contents would result in production of less than one million pounds at the projected maximum flow rate of approximately 6,000 gpm.
The production rate in 2022 is modeled here to be 0.17 million pound per year and, increase to approximately one million pounds per year beginning in 2023. Production is currently modeled to decrease slightly in 2034 based on current production estimates and complete in 2035. Total life of mine production of 12.3 million pounds is based on the resource estimate for the 12 RAs summarized in Table 8 and a future recovery rate of 80 percent. Market conditions and contract sales generally define the production rate for the Project.
Within a mine unit, the most fundamental component of mine development and production is the production pattern. A pattern consists of one recovery well and the injection wells which feed lixiviant to it. Injection wells are commonly shared by multiple recovery wells. HHs serve multiple patterns and function as both distribution points for injection flow and collection points for production flow from the recovery wells. The processing plant feeds injection lixiviant to the HHs for distribution to the injector wells, and also receives and processes production flow from the HHs.
In MU1 the first series of HHs was constructed simultaneously with the processing plant and the site infrastructure. The other HHs as originally planned, were brought online sequentially. The proposed production rate has provided for lower than nominal plant flowrates. Additional mine units will be developed in such a way as to allow for production/plant capacity to be maintained. In other words, as the productivity or head grade from the initial HHs decreases below economic limits, replacement patterns from additional HHs will be placed into operation in order to maintain the desired flow rate and head grade at the plant.
The schedules for drilling, construction, production, and restoration activities for the current life of mine are detailed in Figure 13. The mine life sequence can be described as production followed by restoration, regulatory approval, and reclamation. Development activities, which include drilling, and surface construction, are planned to continue until the first quarter of 2034. Final wellfield production will occur in the fourth quarter of 2035. Restoration and reclamation activities are scheduled to start soon after production is completed in a mine unit or resource area. These are planned to occur from the fourth quarter 2024 through the third quarter 2038. Final decommissioning will occur simultaneous to the reclamation activities of the last mine unit.
| Ur-Energy – Lost Creek ISR Uranium Property Amended Technical Report Summary – September 19, 2022 | Page 69 |
|
|
|

| Ur-Energy – Lost Creek ISR Uranium Property Amended Technical Report Summary – September 19, 2022 | Page 70 |
|
|
|
Table 8. Development Summary by Resource Area
| Resource Area | Total Resource (lbs. x 1000) | Recoveries (lbs. x 1000) | Project | Horizon | Injection Wells | Production Wells | Header Houses | Monitor Wells | Area Under Pattern (acre) | Average Depth (ft.) |
| 1 (MU1) | 2,299 | 1,683 | Lost Cr | HJ | 1266 | 598 | 24 | 102 | 98.4 | 450 |
| 2 (MU2) | 2,699 | 1,744 | Lost Cr | HJ | 744 | 372 | 14 | 119 | 117.5 | 500 |
| 3 | 1,107 | 886 | Lost Cr | KM | 296 | 148 | 6 | 57 | 38.6 | 560 |
| 4 | 570 | 468 | Lost Cr | HJ | 152 | 76 | 3 | 58 | 35 | 580 |
| 5 | 1,091 | 872 | Lost Cr | HJ | 290 | 145 | 6 | 68 | 49.6 | 430 |
| 6 | 1,852 | 1,481 | Lost Cr | FG | 494 | 247 | 9 | 125 | 94.6 | 310 |
| 7 | 2,883 | 2,306 | LC East | HJ | 768 | 384 | 14 | 195 | 140.2 | 380 |
| 8 | 936 | 748 | LC East | KM | 250 | 125 | 5 | 117 | 61.7 | 480 |
| 9 | 618 | 495 | LC East | HJ | 164 | 82 | 3 | 120 | 83.2 | 380 |
| 10 | 485 | 388 | LC East | KM | 130 | 65 | 3 | 88 | 55.4 | 450 |
| 11 | 435 | 348 | LC East | KM | 116 | 58 | 3 | 77 | 43.3 | 350 |
| 12 | 1,054 | 843 | Lost Cr | KM | 282 | 141 | 6 | 78 | 58.6 | 620 |
| Total | 16,029 | 12,261 |
|
| 4,952 | 2,441 |
|
| 876.1 |
|
| 1. | Sum of pounds may not add to the reported total due to rounding. |
| 2. | For economic analyses in this Report, total resources include Measured, Indicated & Inferred Resources |
| 3. | This summary excludes resources recovered through December 31, 2021 (2,436,500 lbs. in MU1 and 298,151 lbs. in MU2) |
| Ur-Energy – Lost Creek ISR Uranium Property Amended Technical Report Summary – September 19, 2022 | Page 71 |
|
|
|
Figure 13. Life of Mine Schedule
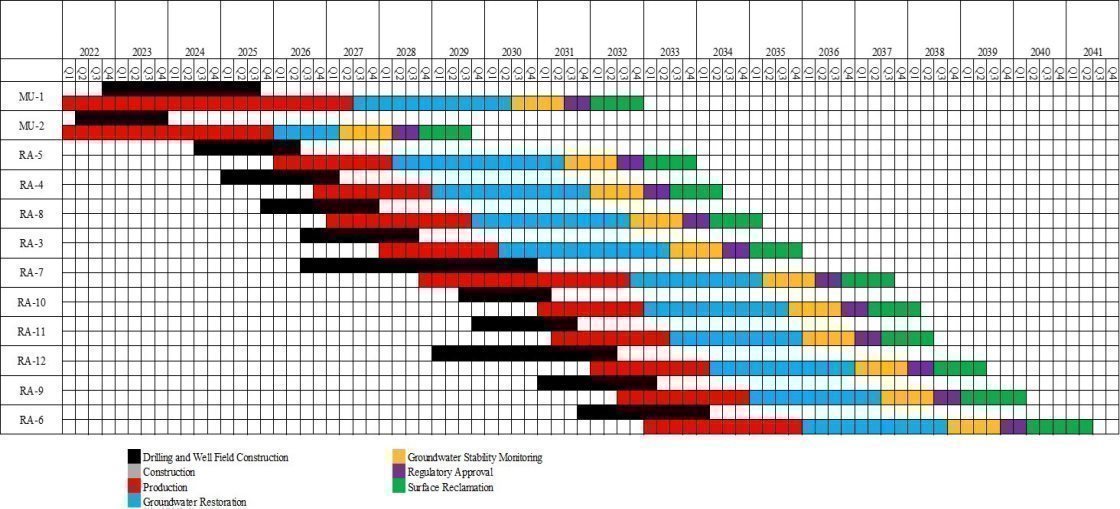
| Ur-Energy – Lost Creek ISR Uranium Property Amended Technical Report Summary – September 19, 2022 | Page 72 |
|
|
|
13.3 Piping
Pipelines transport the wellfield solutions to and from the IX columns of the plant. The flow rates and pressures of the individual well lines are monitored in the HHs. Flow and pressure of the field production systems are also monitored and controlled as appropriate at the HHs. High density polyethylene (HDPE), PVC, stainless steel, or equivalent piping is used in the wellfields and has been designed and selected to meet design operating conditions. The lines from the plant, HHs, and individual well lines are buried for freeze protection and to minimize pipe movement.
13.4 Header Houses
HHs are used to distribute lixiviant injection fluid to injection wells and collect pregnant solution from production wells. Each header house is connected to two trunk lines, one for receiving barren lixiviant from the plant and one for conveying pregnant solutions to the plant. The HHs include manifolds, valves, flow meters, pressure gauges, instrumentation and oxygen for incorporation into the injection lixiviant, as required. Each header house may service up to 90 wells (injection and recovery) depending on pattern geometry.
13.5 Wellfield Reagents, Electricity
The evaluation presented in this Report assumes, based on a nominal 6,000 gpm flowrate, annually, the use of the following reagents and electricity in the wellfield on an annual basis:
| Oxygen |
| 59 |
| million standard cubic ft. |
| Carbon dioxide |
| 931 |
| tons |
| Corrosion inhibitor |
| 16.5 |
| barrels |
| Electricity |
| 11.0 |
| million kilowatt-hours (kWh) |
13.6 Mining Fleet Equipment and Machinery
This evaluation includes the cost of the required equipment and machinery to support the installation and operation of wellfields, the plant, and post-mining reclamation activities. A summary listing of this equipment and machinery includes: two (2) 1-ton pickup trucks; two (2) pulling units; four (4) trailers; six (6) cementers; one (1) front end loader; four (4) telehandlers; three (3) backhoes; one (1) motor grader; one (1) forklift; one (1) logging truck; one (1) MIT truck; one (1) pipe chipper; two (2) hose reels; two (2) flat reels; four (4) HDPE fusion tools; ten (10) portable generators; and various hand tools, radios and computers.
13.7 Mining Personnel
This evaluation includes the cost of the personnel required to operate the wellfield, plant, and mine administration. The maximum number of FTE positions at any one time is projected to be 54.5. The wellfield department will have up to 38.5 full time equivalent (FTE) positions which include all personnel required for drilling, casing, logging, operations, and reclamation. The plant department will have up to 13.5 FTE positions which would include personnel required to operate and maintain the satellite plant. The mine administration will require up to 7.5 FTE positions to oversee mine operations, safety, and technical support staff. The actual number of FTE positions will vary depending on production and wellfield development needs.
| Ur-Energy – Lost Creek ISR Uranium Property Amended Technical Report Summary – September 19, 2022 | Page 73 |
|
|
|
14.0 PROCESSING AND RECOVERY METHODS
The plant, which has been in operation since August 2013, consists of four major solution circuits:
|
| 1. | Uranium recovery/extraction circuit (IX); |
|
| 2. | Elution circuit to remove the uranium from the IX resin; |
|
| 3. | Yellowcake precipitation circuit; and the |
|
| 4. | Dewatering, drying and packaging circuit. |
Figure 14 presents a simplified typical process flow diagram. The system recycles and reuses most of the solutions inside each circuit. A low-volume bleed is permanently removed from the water-based leaching solution flow to create a “cone of depression” in the wellfield’s static water level, to ensure that the leaching solution in the target mineralized zone is contained within the designated recovery area by the inward movement of regional groundwater. This bleed solution is routed to DDWs after minimizing volumes through treatment and recycling.
14.1 Plant Processing
The plant houses most of the process equipment in an approximate 160 ft. by 260 ft. metal building. However, hydrochloric acid, propane and soda ash are stored in tanks and silos outside of the process building. The water treatment system (reverse osmosis) used for treating the bleed and for aquifer restoration is currently located in the plant as well. However, the Project plans to install a separate wastewater treatment building adjacent to the existing plant to enhance current capabilities by adding additional levels of RO and fines removal. The costs are included in the modeled sustaining capital. An analytical laboratory and the office are located in the same building as the plant. A shop building is located immediately north of the plant. In addition to office space for professional staff and the laboratory, the building includes the computer server room, lunchroom, and restroom/change room facilities. The shop building contains the warehouse, maintenance and construction shop areas and the drilling shop with all the required equipment and supplies to perform maintenance and construction of wellfield systems.
Production fluid containing dissolved uranyl carbonate from the wellfields is pumped to the plant for beneficiation as described below:
IX Circuit -- Uranium liberated from the underground deposits is extracted from the pregnant solution in the IX circuit onto resin. Subsequently, the barren lixiviant is reconstituted to the proper bicarbonate strength, as needed via the addition of sodium bicarbonate or carbon dioxide which generates bicarbonate in the mine horizon, and pH is corrected using carbon dioxide prior to being pumped back to the wellfield for reinjection. A low-volume bleed is permanently removed from the lixiviant flow. The bleed is either disposed of directly or treated by reverse osmosis and the clean permeate is reused in the process or injected in a Class V well, as needed. Brine and excess bleed are disposed of by means of injection into DDWs.
Elution Circuit -- When it is fully loaded with uranyl carbonate, the IX resin is subjected to elution. The elution process reverses the loading reactions for the IX resin and strips the uranium from the resin. The resulting rich eluate is an aqueous solution containing uranyl carbonate, salt and sodium carbonate and/or sodium bicarbonate.
| Ur-Energy – Lost Creek ISR Uranium Property Amended Technical Report Summary – September 19, 2022 | Page 74 |
|
|
|
Figure 14. Process Flow Diagram

| Ur-Energy – Lost Creek ISR Uranium Property Amended Technical Report Summary – September 19, 2022 | Page 75 |
|
|
|
Yellowcake Precipitation Circuit -- Yellowcake is produced from the rich eluate. The eluate from the elution circuit is de-carbonated in tanks by lowering the pH to approximately two standard units with hydrochloric acid. The uranium is then precipitated with hydrogen peroxide using sodium hydroxide for pH control.
Yellowcake Dewatering, Drying and Packaging Circuit -- The precipitated yellowcake slurry is transferred to a filter press where excess liquid is removed. Following a freshwater wash step that flushes any remaining dissolved chlorides, the resulting product cake is transferred to a yellowcake dryer, which will further reduce the moisture content, yielding the final dried free-flowing product. Refined yellowcake is packaged in 55-gallon steel drums.
For the purposes of the economic analyses, it was assumed that all drummed yellowcake will be shipped via truck approximately 1,270 miles to the conversion facility in Metropolis, Illinois. This conversion facility is the first manufacturing step in converting the yellowcake into reactor fuel.
14.2 Energy, Water and Process Materials
Estimates used in the evaluation presented in this Report assume the annual consumption of approximately 69,000 gallons of propane and 13.5 million kWh of electricity to heat and light the plant and operate the process equipment.
The consumptive use of groundwater at the Property is related to plant processes, maintenance of a hydrologic cone of depression (bleed) in the operating wellfields and wastewater associated with restoration groundwater sweep and reverse osmosis. The use of primary and secondary reverse osmosis along with radium treatment allows for a portion of the water to be recycled for operational purposes as well as being disposed in UIC Class V wells adjacent to the plant. The Class V permit for this activity was received in 2016. At full operating capacity, the processing plant utilizes approximately 10 gpm of water. In addition, the hydrologic bleed requirements for the wellfields are 0.5 percent to 1.5 percent of the production flowrate. The total expected wastewater output is planned from 10 gpm to 15 gpm at peak production in conjunction with all restoration activities, utilizing a multi-tier RO process in the proposed wastewater building. Chemicals that are anticipated to be used in the plant processes and the assumed annual consumption rates include:
| Hydrochloric acid |
| 4.00 |
| million lbs./year |
| Caustic soda |
| 1.02 |
| million lbs./year |
| Peroxide |
| 0.35 |
| million lbs./year |
| Salt |
| 1.56 |
| million lbs./year |
| Soda ash or bicarbonate* |
| 1.97 |
| million lbs./year |
| Diatomaceous Earth |
| 0.16 |
| million lbs./year |
| Resin (make-up/replacement) |
| 100 |
| cubic ft./year |
* assumes soda ash will be used to supplement bicarbonate levels in lixiviant.
| Ur-Energy – Lost Creek ISR Uranium Property Amended Technical Report Summary – September 19, 2022 | Page 76 |
|
|
|
The above annual chemical usage is based on an average daily flow rate of 6,000 gpm and a production rate of one million pounds U3O8 per year.
The different types of chemicals are stored, used and managed to ensure worker and environmental safety in accordance with standards developed by regulatory agencies and vendors. The hydrochloric acid and hydrogen peroxide, salt and sodium hydroxide storage areas include secondary containment. Sodium hydroxide and the various acid and caustic chemicals are of potential concern and are stored and handled with care. To prevent unintentional releases of hazardous chemicals and limit potential impacts to workers, the public and the environment, URE is implementing and maintaining internal operating procedures consistent with federal, state and local requirements.
14.3 Liquid Disposal
Typical ISR mining operations require one or more disposal wells for limited quantities of fluids that cannot be returned to the production aquifers. Five DDWs are permitted at Lost Creek of which three have been installed. One of the wells was subsequently abandoned and the other two and are operating intermittently as needed. The existing CAPEX and OPEX estimates for this Report assume that the two DDWs currently installed will be supplemented by one additional DDW once restoration begins in earnest. The maximum volume of liquid wastes sent to the deep wells will be from 10 gpm to 15 gpm depending on the required bleed level. This is based on plans to install a separate wastewater treatment building adjacent to the existing plant to enhance current capabilities by adding additional levels of RO and fines removal. The costs are included in the modeled sustaining capital.
In addition to these DDWs and the water treatment plant, URE has obtained regulatory authorization from WDEQ and the NRC to operate UIC Class V wells which will allow for the onsite disposal of fresh permeate (i.e., clean water). Operators use the reverse osmosis circuits and a radium treatment process to treat process wastewater into brine and permeate streams. The brine stream will continue to be disposed of in the DDWs while the clean, permeate stream will be injected into the UIC Class V wells. As expected, these operational procedures have significantly enhanced wastewater disposal capacity at the site.
14.4 Solid Waste Disposal
Solid wastes consist of spent resin, filtered fines from the wellfield and wastewater, empty packaging, miscellaneous pipes and fittings, tank sediments, used personal protective equipment and domestic trash. These materials are classified as contaminated or non-contaminated based on their radiological characteristics.
Non-contaminated solid waste is waste which is not contaminated with radioactive material, or which can be decontaminated and re-classified as non-contaminated waste. This type of waste may include trash, piping, valves, instrumentation, equipment and any other items which are not contaminated, or which may be successfully decontaminated. Current estimates are that the site will produce approximately 700 cubic yards of non-contaminated solid waste per year. Non- contaminated solid waste is collected in designated areas at the Property site and disposed of in the nearest permitted sanitary landfill.
Contaminated solid waste consists of solid waste contaminated with radioactive material that cannot be decontaminated. This waste will be classified as 11e.(2) by-product material as defined by federal and state regulations. This by-product material consists of filters, filtered fines from the wellfield and wastewater, personal protective equipment, spent resin, piping, etc. These materials are temporarily stored on-site and periodically transported for disposal. Another subsidiary of URE owns a licensed disposal facility for 11e.(2) by-product material waste. It is estimated that the Lost Creek site will produce approximately 270 cubic yards of 11e.(2) by-product material as waste per year. This estimate is based on the waste generation rates of similar in situ uranium recovery facilities.
14.5 Plant Personnel
A discussion of the personnel requirements for the Property is located in Chapter 13.7.
| Ur-Energy – Lost Creek ISR Uranium Property Amended Technical Report Summary – September 19, 2022 | Page 77 |
|
|
|
15.0 PROJECT INFRASTRUCTURE
The infrastructure for the Lost Creek wellfield and plant is described above and depicted in Figure 15. All necessary components for the plant and the first wellfield have been constructed and are in use.
15.1 Roads
There are four types of roads being used for access to the Property. They include primary access roads, secondary access roads, temporary wellfield access roads, and well access roads. Access to the Property is from the west via Wamsutter-Crooks Gap Road or from the east via BLM Sooner Road (Figure 2).
Primary access roads are used for routine access to the main processing facility at the Property. URE has constructed approximately 50,000 ft. of new road to serve as Project access.
The main access roads average 20 ft. wide and are surfaced with gravel. Snow removal and periodic surface maintenance are performed as needed. The secondary access roads are used at the Property to provide access to the wellfield HHs. The secondary access roads are constructed with limited cut and fill construction and may be surfaced with small sized aggregate or other appropriate material.
The temporary wellfield access roads are for access to drilling sites, wellfield development, or ancillary areas assisting in wellfield development. When possible, URE will use existing two-track trails or designate two-track trails where the land surface is not typically modified to accommodate the road. The temporary wellfield access roads will be used throughout the mining areas and will be reclaimed at the end of mining.
15.2 Laboratory Equipment
Laboratory equipment consists of inductively coupled plasma (ICP) emission spectrometers for analyses of uranium and metals, an auto-titrator for alkalinity and chloride measurements, specific conductance meter and other equipment, materials and supplies required to efficiently operate the mine and plant. In addition, the laboratory has fume hoods, reagent storage cabinets and other safety equipment. All equipment was purchased and installed prior to the operation of the laboratory in 2013 and continues in use today. Currently, URE plans to move the chemical lab to a new Casper, Wyoming facility being built for URE in 2022. When the facility is constructed, a determination for the timing of the move will be made. The Casper lab is then expected to serve Lost Creek and, when constructed, the Shirley Basin Project mine.
15.3 Electricity
A pre-existing 34,500-volt power line owned by Pacific Power Corp. extends north-south along the western edge of the Lost Creek Project. The line was originally installed to serve the Sweetwater Mine and Mill which is south of the Property. Pacific Power Corp. performed a power study and determined that the line has capacity to serve the Property without any upgrades. A new overhead raptor resistant power line, approximately two miles in length, was constructed to bring power from the existing Pacific Power line to the Lost Creek plant. Line drops have been made to the existing HHs, plant, and other buildings where the power is transformed to three phase 480 volts. Power lines from HHs to recovery wells are placed underground using direct burial wire.
| Ur-Energy – Lost Creek ISR Uranium Property Amended Technical Report Summary – September 19, 2022 | Page 78 |
|
|
|
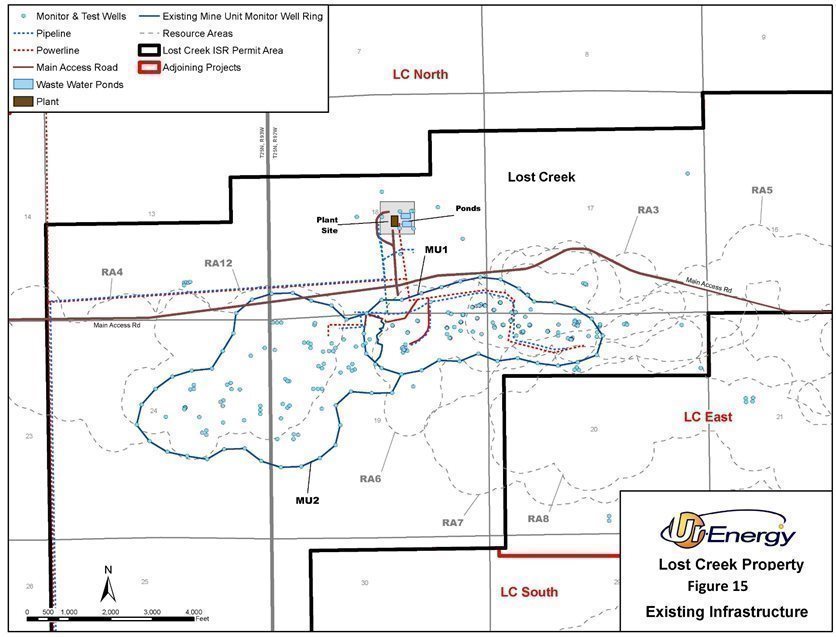
| Ur-Energy – Lost Creek ISR Uranium Property Amended Technical Report Summary – September 19, 2022 | Page 79 |
|
|
|
15.4 Water
URE has drilled 12 shallow water wells to provide water for the facility. The water supply is described in more detail within Chapter 4.5.1.
15.5 Holding Ponds
Two holding ponds have been installed for the facility and are currently in use. The holding ponds, which are located immediately east of the plant, are used to contain process wastewater as needed in relation to wastewater disposal capacity. The earthen banked ponds each are approximately 155 by 260 ft. as measured from crest to crest. The ponds have a double lined containment system with leak detection between the liners. Rigorous procedures have been established to ensure proper inspection, operation, and maintenance of the holding ponds.
| Ur-Energy – Lost Creek ISR Uranium Property Amended Technical Report Summary – September 19, 2022 | Page 80 |
|
|
|
16.0 MARKET STUDIES AND CONTRACTS
This Report serves to replace the most recent assessment of the Property (TREC, 2016) dated February 2016 including updating the economic analyses, and covers activities conducted through December 31, 2021, as described.
Unlike other commodities, uranium does not trade on an open market. Contracts are negotiated privately by buyers and sellers. The economic analysis assumes a variable price per pound for U3O8 over the life of the Property as discussed in Chapter 19.
The future price assumptions were created by taking the simple average (mean) of the annual price projections prepared by four independent financial firms; VIII Capital Corp., Cantor Fitzgerald Canada Corporation, H.C. Wainwright & Co. and UxC, LLC. Each of the projections was independently prepared and reflects the individual, proprietary projections of each firm regarding future uranium prices. The projections were prepared by the firm as of the date of the specific reports (VIII Capital Corp., November 4, 2021; Cantor Fitzgerald Canada Corporation, October 18, 2021; H.C. Wainwright & Co., September 29, 2021; and UxC, LLC, December 6, 2021. See also Chapter 24 References). In certain cases, the price projections provided by the firms did not extend through 2036, which is the final year used in the economic analysis. In that circumstance, the final year of that firm's price projection was used in calculating the average for all subsequent years, ensuring that four different values were averaged for each year in the economic analysis.
The marketability of uranium and acceptance of uranium mining is subject to numerous factors beyond the control of URE. The price of uranium may experience volatile and significant price movements over short periods of time. Factors beyond our control affect the market, including demand for nuclear power; changes in public acceptance of nuclear power generation; political and economic conditions in uranium mining, producing and consuming countries; costs and availability of financing of nuclear plants; changes in governmental regulations; global or regional consumption patterns; speculative activities and increased production due to new extraction developments and improved production methods; the future viability and acceptance of small modular reactors or micro-reactors and the related fuel requirements for this new technology; reprocessing of spent fuel and the re-enrichment of depleted uranium tails or waste; and global economics, including currency exchange rates, interest rates and expectations of inflation. Any future accidents, or threats of or incidents of war, civil unrest or terrorism, at nuclear facilities are likely to also impact the conditions of uranium mining and the use and acceptance of nuclear energy. The economic analysis and associated sensitivities are within the range of current market variability.
Currently, URE has no uranium sales agreements related to the Property.
Operational purchasing agreements exist with the primary chemical suppliers. The terms of these agreements vary in duration and volume. Finally, contracts or agreements are in place with RSB Logistics Inc. for transporting yellowcake from the Property; ConverDyn for processing of yellowcake concentrates; and Pathfinder Mines (a wholly owned subsidiary of Ur-Energy USA Inc.) for disposal of 11e.(2) byproduct material waste.
| Ur-Energy – Lost Creek ISR Uranium Property Amended Technical Report Summary – September 19, 2022 | Page 81 |
|
|
|
17.0 ENVIRONMENTAL STUDIES, PERMITTING, SOCIAL OR COMMUNITY IMPACT
Extensive environmental studies have been performed in support of the Lost Creek Permit to Mine Application submitted to the WDEQ, the License Application submitted to the NRC, and the BLM Plan of Operations (Ur-Energy Inc., 2007a and Ur-Energy Inc., 2007b). Additional, similar environmental studies were completed with respect to the applications to amend those permits, licenses and authorizations for the recovery of uranium from the LC East Project and the KM Horizon at the Lost Creek Project (Lost Creek 2014a and Lost Creek 2014b). These studies include: geology, surface hydrology, sub-surface hydrology, geochemistry, wetlands, air quality, vegetation, wildlife, archeology, meteorology, background radiometrics, and soils. Upon receipt of the applications for the Lost Creek Project, the WDEQ and NRC spent several years reviewing the environmental studies with internal and third-party experts and ultimately concluded that the mining activity as proposed was protective of the environment. After their technical reviews, including numerous opportunities for public comment, all necessary permits and licenses to operate the mine were issued.
The amendment to the LQD authorized permit to mine to allow mining in the HJ and KM Horizons at the LC East Project is the only remaining major authorization before operations may proceed at LC East. Approval will include an aquifer exemption. Additional approval from LQD to expand mining into additional HJ Horizon mine units at the Lost Creek Project must also be obtained.
17.1 Environmental Studies
The license and mine permit applications were developed to define and evaluate the potential for impacts to other environmental resources and were submitted to and approved by the NRC, WDEQ and BLM. Evaluation subjects included: existing and anticipated land use, transportation, geology, soils, seismic risk, water resources, climate/meteorology, vegetation, wetlands, wildlife, air quality, noise, and historic and cultural resources. Additionally, socioeconomic characteristics in the vicinity of the Property were evaluated. In these evaluations, no impacts from Property development were identified that could not be mitigated (Ur-Energy Inc., 2007a, 2007b). The NRC and WDEQ issued final approvals for the Lost Creek Project in 2011. The BLM issued its Record of Decision for approval of the Environmental Impact Statement in October 2012. The BLM issued its Record of Decision for LC East and the KM amendment in March 2019. The WDEQ URP issued final approval of LC East in 2021. Discussion of the results of site-specific environmental studies is given below.
17.1.1 Background Radiological Characteristics
Background radiological characteristics for the Lost Creek Project were evaluated in 2006 and 2007 and between 2012 and 2016 in the LC East area to establish radiological baseline conditions and document the pre-operational radiological environment. The evaluations were performed for surface soils, subsurface soils, sediment and flora. In addition, a baseline gamma survey was performed, and Radon-222 and direct gamma exposure rates were measured.
The results of the studies are presented in detail in the Ur-Energy, Lost Creek ISR Project, Wyoming DEQ Permit to Mine Application (Ur-Energy, 2007a), Ur-Energy, KM and LC East Amendments, 2014, (Ur-Energy, 2014a and Ur-Energy, 2014b), the Ur-Energy, Lost Creek, NRC Source Material License Application, 2007 (Ur-Energy, 2007b) and the Ur-Energy, KM and LC East Amendment Source Material License Application, 2017 (ref. Ur-Energy, 2017). In general, the baseline study indicates that most site radiological properties are in normal ranges. (Lost Creek 2014a, 2014b and BLM 2018).
| Ur-Energy – Lost Creek ISR Uranium Property Amended Technical Report Summary – September 19, 2022 | Page 82 |
|
|
|
17.1.2 Threatened, Endangered, or Candidate Species
As defined by WDEQ-LQD Guideline No. 2, a literature review was conducted to identify species of special concern, prohibited and restricted noxious weeds, and selenium indicators that could be present within the Lost Creek Project permit area and again for permitting of the LC East Project amendments. The reviews identified several species that occur within the general region.
Threatened and endangered (T&E) species of the greater region include the blowout penstemon (Penstemon haydenii) and the desert yellowhead (Yermo xanthocephalus). Blowout penstemon is the only endangered plant species in Wyoming. While the species is known to occur on a site approximately 32 miles east-northeast of the Lost Creek Project, it has not been observed in the area of the properties and is unlikely to occur in the area. Blowout penstemon grows exclusively in sand blowout areas, a habitat type which is absent in the Property. Desert yellowhead is a threatened species in Wyoming, occurring in southern Fremont County in the Beaver Rim Area, approximately 45 miles northeast of Lost Creek. The only known population occurs in the Beaver Rim Area.
A similar analysis was conducted within the LC East Project area. According to the USFWS, T&E species known to occur within Sweetwater County include Ute ladies’-tresses (Spiranthes diluvialis) and the western prairie fringed orchid (Platanthera praeclara) (USFWS 2015b). A more refined search area that included just the immediate vicinity of the Property area identified only the potential for Ute ladies’-tresses (USFWS 2017). The field evaluations conducted during the appropriate time frame indicated that late season perennial water sources were not present within the LC East Project area. No individuals or populations of Ute ladies’-tresses were found during field surveys and based on the lack of suitable habitat characteristics, local habitat was confirmed unsuitable for Ute ladies’-tresses.
An additional 12 rare plant species are known to occur in Sweetwater County. During the vegetation surveys, special consideration was given to these species of special concern and micro-environments capable of supporting these species. However, no species of special concern were observed within the Lost Creek Project.
As discussed above, the USFWS issued a determination in 2015 that the greater sage grouse, which is indigenous to the area, does not warrant protection under the ESA. Management of the species will continue under the Wyoming Core Area Strategy, and certain federal, resource management plans. In addition, for the LC East Amendment the WGFD was consulted regarding greater sage-grouse since the Property area is within a BLM Priority Habitat Management Area. The Density Disturbance Calculation Tool (DDCT) prepared for the existing Lost Creek Project was updated to ensure that the LC East Project would be in compliance with the maximum disturbance process, as outlined in Wyoming EO 2015-4 (Office of the Governor 2015). WGFD reviewed the revised DDCT and concluded that the LC East project complies with the 5 percent and 1/640 thresholds (WGFD 2018).
| Ur-Energy – Lost Creek ISR Uranium Property Amended Technical Report Summary – September 19, 2022 | Page 83 |
|
|
|
17.1.3 Cultural and Historic Resources
Pursuant to applicable regulations, the cultural and historic resources are not publicly disclosed.
17.1.4 Visual and Scenic Resources
During construction and operations, visual resources will be impacted to some extent by vegetative disturbance, road building, drilling, piping, and facility construction. A maximum of approximately 165 acres of vegetation will be disturbed at any one time. This estimate includes all on-site roads, operating mine units, mud pits for resource and delineation and monitor wells, and pipelines. The total footprint of the plant compound is approximately 10 acres, and the maximum height of any building is 45 feet. Mine unit development will occur sequentially, with reclamation in the MU1 concurrent with construction and operations in later mine units. No more than four percent of the Lost Creek Project permit area should be disturbed at any time.
Most of these modifications will not be visible from the public road network, which is lightly traveled. The plant is located 4.5 miles from the nearest county road, and the rolling topography will hide the facilities from travelers, except from a limited number of vantage points. There are no locally important or high-quality views that are affected by the Property. Facilities are discernable but are not a dominant landscape feature to observers outside the Lost Creek permit area.
Impacts are temporary, since buildings and roads will be decommissioned and removed at the Property’s end and vegetation will be restored to its previous condition. ISR operations cause no modifications to scenery or topography that will persist after restoration and reclamation.
17.1.5 Byproduct Disposal
11e.(2) or non-11e.(2) byproduct disposal methods are discussed in detail in Chapter 14.0 (Recovery Methods). DDWs, landfills, and licensed 11e.(2) facilities will be used depending on the level of contamination for the given waste product.
17.2 Permitting Requirements, Permit Status, Financial Assurance
Permitting requirements and status are also discussed in Chapter 3.5.2.
17.2.1 Financial Assurance
Financial surety is required by the State of Wyoming and the BLM. Through an MOU between BLM and WDEQ-LQD (BLM 2003), BLM has given WDEQ-LQD primacy for establishing the financial assurance amount for operations covered under 43 CFR § 3809.500. However, BLM reviews financial assurance estimates and retains the authority to require additional financial assurance if it determines that the reclamation cost estimate is inadequate. The Property currently has in place financial assurance to cover costs of reclaiming lands and groundwater currently disturbed at the Lost Creek Project. Reclamation costs for additional disturbance would be added to the financial assurance prior to constructing facilities in the LC East Project. As required by WDEQ-LQD Permit to Mine PT788 and URP License WYSUA-1598, the financial assurance would be reevaluated, and the amount updated annually to reflect any approved expansions or additional disturbance planned for the upcoming year, as well as any reclamation completed during the preceding year. Updates to the financial assurance estimate would be reviewed and approved by URP and WDEQ-LQD. Under the MOU between BLM and WDEQ-LQD, BLM would also review the annual financial assurance updates and concur with the proposed updates or recommend modifications to WDEQ-LQD (BLM 2003). The financial assurance instrument would be redeemable by both the State of Wyoming and the U.S. Secretary of the Interior (BLM).
| Ur-Energy – Lost Creek ISR Uranium Property Amended Technical Report Summary – September 19, 2022 | Page 84 |
|
|
|
17.2.3 Site Monitoring
URE conducts considerable site monitoring to ensure protection of the environment and also protection of employees and the public from radionuclide effluent. Each mine unit is or will be surrounded laterally and vertically with a series of monitor wells to ensure mining solutions do not migrate out of the mining zone. The wells will be sampled twice per month with the results compared against pre-determined upper control limits.
Significant environmental monitoring for radionuclide effluents is also occurring and will continue up until reclamation. Selected sites are monitored for gamma radiation and radon levels. Sampling devices are replaced each quarter during operations and continue through groundwater restoration. Additionally, some sites are monitored to determine the concentration of airborne radionuclides. The air filters in the devices are changed out about every two weeks and quarterly composites are submitted to a contract laboratory for analysis. The laboratory results will be compared against baseline values to determine if any upward trend is occurring. The radionuclide concentration in local soils, surface water and vegetation will also be monitored to determine if mine effluent is causing impacts.
Finally, wildlife monitoring will continue throughout the life of the mine and will cover a variety of species including greater sage-grouse, big game, migratory birds, lagomorphs, songbirds and other species deemed to be of concern by permitting agencies. Third-party contractors will be utilized to perform wildlife monitoring.
17.3 Community Affairs
The Property is proximate to the communities of Bairoil, Jeffrey City, Wamsutter, Riverton, Lander and Rawlins, Wyoming. Lost Creek personnel have been hired from these communities as well as from Hanna, Rock Springs, and Casper, Wyoming. Employment has had a positive impact to these communities not only through direct payroll, but through primary and secondary purchases of goods and services.
URE maintains routine contacts with landowners, the BLM, and the general public through direct calls and attending various local meetings. The operational managers and Radiation Safety Officer are on site at the facility and are included in the administrative support labor costs in operating costs.
The NRC, WDEQ and BLM evaluated socioeconomic characteristics in the vicinity of the Property. No impacts from Property development were identified that could not be mitigated (Ur-Energy, 2007a, 2007b; Lost Creek, 2014a, 2014b). The NRC and WDEQ issued final approvals for the Lost Creek Project in 2011; URP issued its license approval in March 2021 for the LC East Project. The BLM issued its Record of Decision for approval of the Environmental Impact Statement in October 2012 and the LC East and KM Amendments in March 2019.
| Ur-Energy – Lost Creek ISR Uranium Property Amended Technical Report Summary – September 19, 2022 | Page 85 |
|
|
|
17.4 Project Closure
Project closure entails multiple activities including the groundwater and surface reclamation which will commence while recovery operations are continuing. The timeline for these closure-related activities is included in Figure 13 (Life of Mine Schedule) and the costs are included in the discussion of OPEX (see Chapter 18.0).
17.4.1 Well Abandonment / Groundwater Restoration
Groundwater restoration will begin as soon as practicable after uranium recovery in each wellfield is completed (as determined by project economics). If a depleted wellfield is near an area that is being recovered, a portion of the depleted area’s restoration may be delayed to limit interference with the ongoing recovery operations.
Restoration completion assumes up to six pore volumes of groundwater will be extracted and treated by reverse osmosis. Following completion of successful restoration activities, the injection and recovery wells will be plugged and abandoned in accordance with WDEQ regulations. Monitor wells will also be abandoned following verification of successful groundwater restoration.
17.4.2 Demolition and Removal of Infrastructure
Simultaneous with well abandonment operations, the trunk and feeder pipelines will be removed, tested for radiological contamination, segregated as either solid 11e.(2) or non-11e.(2) byproduct material, then chipped and transported to appropriate disposal facilities. The HHs will be disconnected from their foundations, decontaminated, segregated as either solid 11e.(2) or non-11e.(2), and transported to appropriate disposal facilities or recycled. The processing equipment and ancillary structures will be demolished, tested for radiological properties, segregated and either scrapped or disposed of in appropriate disposal facilities based on their radiological properties.
17.4.3 Site Grading and Revegetation
Following the removal of wellfield and plant infrastructure, site roads will likely be removed and the site will be re-graded to approximate pre-development contours and the stockpiled topsoil placed over disturbed areas. The disturbed areas will then be seeded.
17.5 Adequacy of Current Plans
The QP has reviewed the current permit status of the Property and have noted that the Project is fully permitted for ISR mining operations. The QPs’ opinion is that URE’s plans are adequate to allow for realization of the mining plans discussed in this Report.
| Ur-Energy – Lost Creek ISR Uranium Property Amended Technical Report Summary – September 19, 2022 | Page 86 |
|
|
|
18.0 CAPITAL AND OPERATING COSTS
Capital Costs (CAPEX) and Operating Costs (OPEX) are based on actual and estimated costs for the Lost Creek Project as of December 31, 2021. For items that recent price quotes were not available the costs were escalated against the Consumer Price Index or the gross domestic product: implicit price deflator adjusted to December 2021 (CPI, 2021 & FRED, 2021). The included analysis is based on the Measured and Indicated plus Inferred mineral resources in the Lost Creek and LC East Projects, as of December 31, 2021. The majority of the CAPEX costs, including the installation of the processing plant, disposal wells and a portion of the drilling and installation of MU1, were incurred prior to the commencement of operations in 2013. OPEX costs include the remaining drilling and installation of the mine units as well as all operating costs such as chemicals, labor, utilities and maintenance. OPEX costs are most sensitive to wellfield costs – which may increase if well spacing needs to be reduced or additional injection/recovery wells are required.
18.1 Capital Cost Estimation (CAPEX)
The majority of the CAPEX occurred prior to the start of operations in 2013 and is herein referred to as “initial capital” (initial capital costs of plant and wellfields total $46.5 million including initial wellfield costs of $12.3 million). Subsequent mine unit drilling and development costs are considered in the OPEX category after the start of production. The only remaining items in the CAPEX category for the remainder of the mine life are in the sustaining capital category.
Remaining CAPEX costs are for sustaining capital requirements at the mine-site and are primarily for the installation of a wastewater treatment building to optimize wastewater reduction. The remaining sustaining capital is for the replacement of equipment that will be used in the future operations of the plant and the wellfields. The sustaining capital cost is estimated to be $19.9 million (Table 11). In addition, costs are included in wellfield development portion of this analysis for the installation of one additional DDW at an estimated cost of $3.2 million. The sustaining capital and future disposal well cost estimates are based on the actual previous purchases of the same equipment and/or vendor prices, thus the estimates contain contingencies of 10 percent and are considered to have a predicted level of accuracy of +/- 10 percent.
18.2 Operating Cost Estimation (OPEX)
The OPEX costs have been developed by evaluating each process unit operation and the associated required services (power, water, air, waste disposal), infrastructure (offices, change rooms shop), salary and burden, and environmental control (heat, air conditioning, monitoring). In addition, OPEX costs also include the remaining construction of the mine unit surface facilities and wells to mine the MMT and EMT. The Annual OPEX and the Closure Cost Summary for the Property are provided in Table 9. Additional annualized OPEX detail is provided in Table 10. Total OPEX costs, including selling, production and operating costs, have been estimated at $205.1 million, or approximately $16.34 per pound. The predicted level of accuracy of the OPEX and Closure estimates is approximately +/- 20 percent. The prices for the major items identified in this Report have been sourced in the United States and are based upon operational experience and data. Major cost categories considered when developing OPEX costs include wellfield, plant and site administration costs as detailed in Tables 9 and 10.
| Ur-Energy – Lost Creek ISR Uranium Property Amended Technical Report Summary – September 19, 2022 | Page 87 |
|
|
|
Table 9. Annual Operating Costs (OPEX) Summary
| Operating Costs Summary |
| Units |
| Total |
|
| US$ per Pound |
| ||
| Salaries and Wages (Plant) |
| US$ 000s |
| $ | 25,260 |
|
| $ | 2.01 |
|
| Salaries and Wages (Wellfield) |
| US$ 000s |
| $ | 37,062 |
|
| $ | 2.95 |
|
| Wellfield costs (excludes closure related) |
| US$ 000s |
| $ | 20,256 |
|
| $ | 1.61 |
|
| Processing Plant Costs (excludes closure related) |
| US$ 000s |
| $ | 63,891 |
|
| $ | 5.09 |
|
| Product Shipping Costs & Conversion Facility Fees |
| US$ 000s |
| $ | 4,449 |
|
| $ | 0.35 |
|
| BLM & State Land Holding & Surface Impact Costs |
| US$ 000s |
| $ | 1,507 |
|
| $ | 0.12 |
|
| URP Fees |
| US$ 000s |
| $ | 2,204 |
|
| $ | 0.18 |
|
| Insurance & Bonding |
| US$ 000s |
| $ | 8,342 |
|
| $ | 0.66 |
|
| Subtotal |
| US$ 000s |
| $ | 162,971 |
|
| $ | 12.99 |
|
| Closure costs (less wages) |
| US$ 000s |
| $ | 30,939 |
|
| $ | 2.47 |
|
| Home Office Support and Allocated Overhead |
| US$ 000s |
| $ | 11,145 |
|
| $ | 0.89 |
|
| Subtotal |
|
|
| $ | 42,084 |
|
| $ | 3.35 |
|
| Total |
| US$ 000s |
| $ | 205,055 |
|
| $ | 16.34 |
|
| 1. | Wellfield operating costs include power, maintenance, chemicals and other wellfield operating costs. |
| 2. | Closure costs assume no salvage value for materials and equipment. |
| 3. | BLM land holding cost assumes an annual assessment of $165 on each claim (469 total). State fees include $1,920 annual lease ($3/acre) plus surface impact. |
| 4. | NRC fees include permitting cost recovery estimates for URP. |
| 5. | Shipping costs are based on 35,000 lbs. yellowcake shipments to the conversion facility in Metropolis, Illinois. |
| 6. | Bonding requires a 2.5% premium to be paid and approximately 30% collateral to be posted. The posted collateral is returned as closure work is completed and the bonding requirement is reduced. |
| 7. | Closure costs are based on WDEQ approved unit costs and detailed engineering work. |
| Ur-Energy – Lost Creek ISR Uranium Property Amended Technical Report Summary – September 19, 2022 | Page 88 |
|
|
|
Table 10. Annual Operating Costs (OPEX) Details
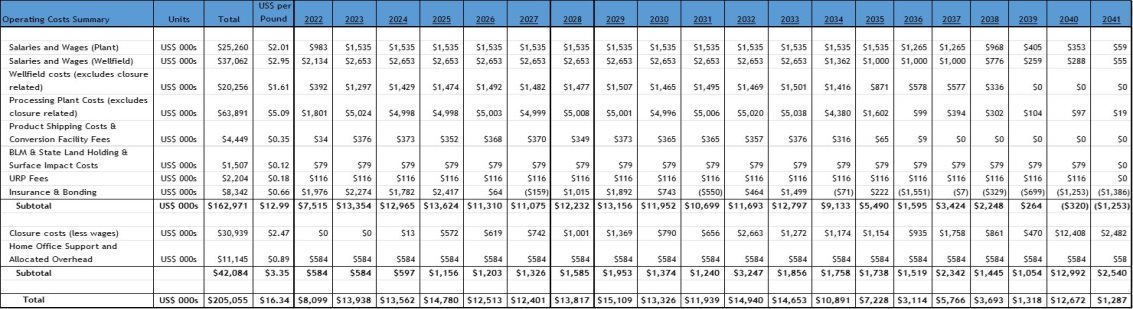
| 1. | Wellfield operating costs include power, maintenance, chemicals and other wellfield operating costs. |
| 2. | Closure costs assume no salvage value for materials and equipment. |
| 3. | BLM land holding cost assumes an annual assessment of $165 on each claim. State fees include $1,920 annual lease ($3/acre) plus surface impact. |
| 4. | URP fees include permitting costs and annual inspections. |
| 5. | Shipping costs are based on 35,000 lbs. yellowcake shipments to the conversion facility in Metropolis, Illinois. |
| 6. | Bonding requires a 2.5% premium to be paid and approximately 30% collateral to be posted. The posted collateral is returned as closure work is completed and the bonding requirement is reduced. |
| 7. | Closure costs are based on WDEQ approved unit costs and detailed engineering work. |
| Ur-Energy – Lost Creek ISR Uranium Property Amended Technical Report Summary – September 19, 2022 | Page 89 |
|
|
|
The OPEX estimate above is based on the current resource estimate for the MMT and EMT on the Property which takes into account the produced pounds.
18.3 Adequacy of Cost Estimates
The cost estimates used for this analysis are based on actual costs encountered at the Lost Creek facility. Since the mine is currently in operation and actual operational costs were used in the analysis, it is the QP’s opinion that the costs used for this analysis are very representative of actual costs that will be encountered. The QP noted during their review that the mine is currently operating at minimal production rates, and as a result, when full mine production resumes, the costs may adjust as the mine competes to hire additional people to operate the facility. However, the QP has noted that the labor costs used for this analysis are current and the mine is already competing for labor in a relatively tight labor market. As a result, significantly underestimating the labor costs is not expected to be a large risk. In addition, recent inflationary pressures and supply chain shortages induced by COVID shutdowns in 2020 and 2021 could result in increased costs for supplies. As noted in this Chapter, the costs were escalated against current inflation estimates to account for inflation concerns. The QP believes that the costs included here are reasonable and represent the best estimate of costs available.
18.4 Wellfield Development Costs
The first series of MU1 HHs were constructed simultaneously with the processing plant and the site infrastructure in 2012 and 2013. Since that time, all originally planned HHs in MU1 and the first three HHs in MU2 have been brought into production. Throughout operations at Lost Creek to date, the production rate has been maintained at lower than design plant flowrate. The nominal plant throughput is modeled at approximately 5,500 to 6,000 gpm for the purposes of development costs for this Report. As the productivity or head grade from the initial HHs decreases below economic limits, replacement patterns from additional HHs will be placed into operation in order to maintain the desired flow rate and head grade at the plant.
The wellfield development costs include both wellfield drilling and wellfield construction activities and were estimated based on current and preliminary future wellfield designs including the number, location, depth, and construction material specifications for wells and HHs and the hydraulic conveyance (piping) system associated with the wellfields. Additionally, trunk and feeder pipelines, electrical service, roads, and wellfield fencing are included in the cost estimates. The wellfield development estimate is based on actual costs from vendors, contractors, labor wages and equipment rates used to drill and construct the constructed portions of MU1 and MU2 and includes a 10 percent contingency. Where cost quotes or purchases occurred in previous years the costs were escalated against current inflation rates (FRED, 2022 and CPI, 2022). The estimated wellfield development cost for the remainder of the Property is $151.7 million or $12.09 per pound and is identified in Table 11.
| Ur-Energy – Lost Creek ISR Uranium Property Amended Technical Report Summary – September 19, 2022 | Page 90 |
|
|
|
19.0 ECONOMIC ANALYSIS
Cautionary statement: This Report is preliminary in nature, and includes inferred mineral resources that are considered too speculative geologically to have the economic considerations applied to them that would enable them to be categorized as mineral reserves. Mineral resources that are not mineral reserves do not have demonstrated economic viability. There is increased risk and uncertainty to commencing and conducting production without established mineral reserves that may result in economic and technical failure which may adversely impact future profitability. The estimated mineral recovery used in this Report is based on recovery data from wellfield operations to date, as well as Ur-Energy personnel and industry experience at similar facilities. There can be no assurance that recovery at this level will be achieved.
This Report serves to evaluate the economic impact of continued operations and replaces the most recent NI 43-101 economic analysis for the Property from February 2016. Since the 2016 analyses, additional development and construction for HH2-1, 2-2, and 2-3 has occurred with additional mineral resources identified.
The economic analyses is based upon an 80 percent recovery of the total resources (Measured, Indicated and Inferred) from the twelve RAs. These 12 designated RAs (Figure 12) represent the accumulation of resources within a given horizon in a given area. Economic analyses are performed solely on these designated areas, due to the vertical and lateral continuity of the resources. To date, RAs 1 and 2 have been converted to MU1 and MU2, respectively. Currently, approximately 85 percent of the total Property resources, as presented in Tables 1 and 7, are contained within RAs.
Finally, the economic analyses here are conducted based upon actual capital costs incurred in the 2012-2013 construction of Lost Creek facilities, eight years of operational data and production costs, and an update of inflation and other economic and market conditions.
19.1 Assumptions
The economic assessment presented in this Report is based on approximately 80 percent recovery of the following total resources defined within the 12 RAs (Table 8):
|
| Measured: | 6.779 million lbs. |
|
|
|
|
|
| Indicated: | 4.686 million lbs. |
|
|
|
|
|
| Inferred: | 4.564 million lbs. |
Note that MU1 and MU2 are in the advanced planning stages and a small portion of the resource is not included within the currently planned, or actual, pattern layouts. The resources not included in the patterns were excluded from the cost analysis and as a result the total quantity of resources in the economic analysis is slightly lower than 80 percent of the resources summarized above. A cash flow statement has been developed based on the CAPEX, OPEX and closure cost estimates and the production schedule. The sale price for the produced uranium is assumed at a variable price per pound for the life of the Property ranging from $50.80 to $66.04 per pound. This price is based on the annual average of the projections prepared by VIII Capital Corp., November 4, 2021; Cantor Fitzgerald Canada Corporation, October 18, 2021; H.C. Wainwright & Co., September 29, 2021; and UxC, LLC, December 6, 2021 (See Chapter 16).
| Ur-Energy – Lost Creek ISR Uranium Property Amended Technical Report Summary – September 19, 2022 | Page 91 |
|
|
|
Uranium recovery from the mineral resource is assumed based on an estimated wellfield recovery factor of 80 percent. The production flow rate, grade and ultimate recovery are based on experience to date at the Property as well as designed plant capacities for flow and production. The sales for the cash flow utilize the production models for each of the mine units and RAs. The total uranium production over the life of the Property is estimated to be 12.3 million pounds.
19.2 Cash Flow Forecast and Production Schedule
This Report contemplates Lost Creek’s start date of August 2, 2013 and incorporates production up to the cutoff time for the economics portion of the Report (December 31, 2021). The NPV assumes cash flows take place in the middle of the periods and is calculated based on a discounted cash flow. The production estimates and OPEX cost distribution (Tables 9 and 10) used to develop the cash flow are based on the production and restoration models developed by URE and incorporated in the cash flow (Tables 11 and 12). The cash flow assumes no escalation, no debt, interest or capital repayment. It should be noted that Lost Creek ISR, LLC is the recipient of the State Bond Loan. Debt interest and repayment of this loan is not included in the economic analysis. It also does not include depreciation. The initial capitalized Project construction was completed prior to start of operations in 2013. Accounting for a sunk cost balance of 23.7 million as of December 31, 2021, the estimated payback of the initial capital investment is estimated during the second quarter of 2024. Excluding sunk costs which occurred prior to December 31, 2021, the Property is estimated to generate net cash flow over its life, before income tax, of $376.4 million and $267.1 million after income tax. The Property has a calculated before tax IRR of 72.2 percent and a before tax NPV of $210.9 million applying an eight percent discount rate. When income taxes are included in the calculation, the after-tax IRR is 66.8 percent and the after tax NPV is $156.8 million applying an eight percent discount rate. LoM operating costs are approximately $33.61 per pound of U3O8 produced including royalties and local taxes. Income taxes are estimated to be $8.72 per pound. The NPV for three discount rates has been calculated (pre- and post-income tax) and is presented in Table 13. The estimated IRR is also presented in Table 13.
Approximately 27.4% percent of the resources in the economic analysis were inferred resources. Inferred resources are resources that are considered too speculative geologically to have modifying factors applied to them that would enable them to be categorized as mineral reserves, and there is no certainty that this economic assessment will be realized. To account for the chance that the inferred resources are not upgraded as mining progresses and URE collects additional drilling data, a second economic analysis was prepared which excluded the inferred resources. The estimated recovery excluding the inferred resources was 8.6 million pounds. Without the inferred resources the Property is estimated to generate net cash flow over its life, before income tax, of $234.8 million and $175.3 million after income tax. Without the inferred resources the calculated before tax IRR is 71.7% percent and a before tax NPV of $153.4 million applying an eight percent discount rate. When income taxes are included in the calculation without inferred resources, the after-tax IRR is 67.0% percent and the after tax NPV is $120.0 million applying an eight percent discount rate. Without the inferred resources LoM) operating costs are estimated at approximately $36.23 per pound of U3O8 produced including royalties and local taxes. Income taxes are estimated to be $6.69 per pound.
| Ur-Energy – Lost Creek ISR Uranium Property Amended Technical Report Summary – September 19, 2022 | Page 92 |
|
|
|
Table 11. Cash Flow Statement ($US 000s)
| Cash Flow Line Items |
| Units |
| Total |
|
| US$ per Pound |
| ||
| Pounds produced |
| Lbs |
|
| 12,261,347 |
|
|
|
| |
| Pounds sold |
| Lbs |
|
| 12,546,207 |
|
|
|
| |
| Sales |
| US$ 000s |
| $ | 798,601 |
|
| $ | 63.65 |
|
| Royalties |
| US$ 000s |
| $ | (440 | ) |
| $ | (0.04 | ) |
| Net sales |
| US$ 000s |
| $ | 798,161 |
|
| $ | 63.62 |
|
| Wyoming severance tax |
| US$ 000s |
| $ | (16,321 | ) |
| $ | (1.30 | ) |
| Sweetwater ad valorem tax |
| US$ 000s |
| $ | (27,598 | ) |
| $ | (2.20 | ) |
| Operating costs (see Table 9) |
| US$ 000s |
| $ | (205,055 | ) |
| $ | (16.34 | ) |
| Wellfield Development |
| US$ 000s |
| $ | (151,733 | ) |
| $ | (12.09 | ) |
| Exploration cost |
| US$ 000s |
| $ | - |
|
| $ | - |
|
| Sweetwater property tax |
| US$ 000s |
| $ | (1,148 | ) |
| $ | (0.09 | ) |
| Working capital changes |
| US$ 000s |
| $ | - |
|
| $ | - |
|
| Project cash flow |
| US$ 000s |
| $ | 396,305 |
|
| $ | 31.59 |
|
| Initial capital |
| US$ 000s |
| $ | - |
|
| $ | - |
|
| Sustaining capital |
| US$ 000s |
| $ | (19,878 | ) |
| $ | (1.58 | ) |
| Net cash flow before tax |
| US$ 000s |
| $ | 376,427 |
|
| $ | 30.00 |
|
| Federal income tax |
| US$ 000s |
| $ | (77,108 | ) |
| $ | (6.15 | ) |
| State income tax |
| US$ 000s |
| $ | (32,265 | ) |
| $ | (2.57 | ) |
| Net cash flow after tax |
| US$ 000s |
| $ | 267,054 |
|
| $ | 21.29 |
|
| 1. | Production is based on an 80% recovery of the total of Measured, Indicated and Inferred resources (per 17 CFR §229.1300, as well as NI 43-101 Section 2.3(3)) in the 12 RAs of the MMT and EMT. |
| 2. | Uranium price is the annual average of the projections of VIII Capital Corp., November 4, 2021; Cantor Fitzgerald Canada Corporation, October 18, 2021; H.C. Wainwright & Co., September 29, 2021; and UxC, LLC, December 6, 2021, as further discussed in Chapter 16. |
| 3. | All amounts in US $ 000s. |
| 4. | Wellfield Development includes wellfield drilling, wellfield construction costs, and costs for installing one proposed disposal well. |
| 5. | Pounds sold exceeds pounds produced due to existing inventories. |
| Ur-Energy – Lost Creek ISR Uranium Property Amended Technical Report Summary – September 19, 2022 | Page 93 |
|
|
|
Table 12. Cash Flow Detail ($US 000s)
| Cash Flow Line Items |
| Units |
| Total |
|
| US$ per Pound |
|
| 2022 |
|
| 2023 |
|
| 2024 |
|
| 2025 |
|
| 2026 |
|
| 2027 |
|
| 2028 |
|
| 2029 |
|
| 2030 |
|
| 2031 |
|
| 2032 |
|
| 2033 |
|
| 2034 |
|
| 2035 |
|
| 2036 |
|
| 2037 |
|
| 2038 |
|
| 2039 |
|
| 2040 |
|
| 2041 |
| ||||||||||||||||||||||
|
|
|
|
|
|
|
|
|
|
|
|
|
|
|
|
|
|
|
|
|
|
|
|
|
|
|
|
|
|
|
|
|
|
|
|
|
|
|
|
|
|
|
|
|
|
|
|
|
|
|
|
|
|
|
|
|
|
|
|
|
|
|
|
|
|
|
|
|
| ||||||||||||||||||||||
| Pounds produced |
| Lbs |
|
| 12,261,347 |
|
|
|
|
|
| 172,182 |
|
|
| 1,011,334 |
|
|
| 1,004,362 |
|
|
| 1,004,226 |
|
|
| 1,005,665 |
|
|
| 1,004,602 |
|
|
| 1,007,133 |
|
|
| 1,005,038 |
|
|
| 1,003,755 |
|
|
| 1,006,609 |
|
|
| 1,010,477 |
|
|
| 1,015,411 |
|
|
| 883,635 |
|
|
| 126,918 |
|
|
| - |
|
|
| - |
|
|
| - |
|
|
| - |
|
|
| - |
|
|
| - |
| |
| Pounds sold |
| Lbs |
|
| 12,546,207 |
|
|
|
|
|
| 300,000 |
|
|
| 1,000,000 |
|
|
| 1,100,000 |
|
|
| 900,000 |
|
|
| 1,000,000 |
|
|
| 1,100,000 |
|
|
| 900,000 |
|
|
| 1,100,000 |
|
|
| 1,000,000 |
|
|
| 1,000,000 |
|
|
| 1,000,000 |
|
|
| 1,000,000 |
|
|
| 900,000 |
|
|
| 200,000 |
|
|
| 46,207 |
|
|
| - |
|
|
| - |
|
|
| - |
|
|
| - |
|
|
| - |
| |
| Average sale price per pound |
| US$ |
|
|
|
|
|
|
|
| $ | 50.80 |
|
| $ | 58.54 |
|
| $ | 61.68 |
|
| $ | 62.10 |
|
| $ | 62.67 |
|
| $ | 63.04 |
|
| $ | 64.15 |
|
| $ | 64.98 |
|
| $ | 66.04 |
|
| $ | 66.04 |
|
| $ | 66.04 |
|
| $ | 66.04 |
|
| $ | 66.04 |
|
| $ | 66.04 |
|
| $ | 66.05 |
|
|
|
|
|
|
|
|
|
|
|
|
|
|
|
|
|
|
|
|
| |
|
|
|
|
|
|
|
|
|
|
|
|
|
|
|
|
|
|
|
|
|
|
|
|
|
|
|
|
|
|
|
|
|
|
|
|
|
|
|
|
|
|
|
|
|
|
|
|
|
|
|
|
|
|
|
|
|
|
|
|
|
|
|
|
|
|
|
|
|
|
|
|
|
|
|
|
|
|
|
|
|
|
|
|
|
|
|
|
|
|
| |
| Sales |
| US$ 000s |
| $ | 798,601 |
|
| $ | 63.65 |
|
| $ | 15,240 |
|
| $ | 58,540 |
|
| $ | 67,848 |
|
| $ | 55,890 |
|
| $ | 62,670 |
|
| $ | 69,344 |
|
| $ | 57,735 |
|
| $ | 71,478 |
|
| $ | 66,040 |
|
| $ | 66,040 |
|
| $ | 66,040 |
|
| $ | 66,040 |
|
| $ | 59,436 |
|
| $ | 13,208 |
|
| $ | 3,052 |
|
| $ | - |
|
| $ | - |
|
| $ | - |
|
| $ | - |
|
| $ | - |
|
| Royalties |
| US$ 000s |
| $ | (440 | ) |
| $ | (0.04 | ) |
| $ | - |
|
| $ | - |
|
| $ | - |
|
| $ | - |
|
| $ | - |
|
| $ | - |
|
| $ | (292 | ) |
| $ | (142 | ) |
| $ | (4 | ) |
| $ | (2 | ) |
| $ | - |
|
| $ | - |
|
| $ | - |
|
| $ | - |
|
| $ | - |
|
| $ | - |
|
| $ | - |
|
| $ | - |
|
| $ | - |
|
| $ | - |
|
| Net sales |
| US$ 000s |
| $ | 798,161 |
|
| $ | 63.62 |
|
| $ | 15,240 |
|
| $ | 58,540 |
|
| $ | 67,848 |
|
| $ | 55,890 |
|
| $ | 62,670 |
|
| $ | 69,344 |
|
| $ | 57,443 |
|
| $ | 71,336 |
|
| $ | 66,036 |
|
| $ | 66,038 |
|
| $ | 66,040 |
|
| $ | 66,040 |
|
| $ | 59,436 |
|
| $ | 13,208 |
|
| $ | 3,052 |
|
| $ | - |
|
| $ | - |
|
| $ | - |
|
| $ | - |
|
| $ | - |
|
|
|
|
|
|
|
|
|
|
|
|
|
|
|
|
|
|
|
|
|
|
|
|
|
|
|
|
|
|
|
|
|
|
|
|
|
|
|
|
|
|
|
|
|
|
|
|
|
|
|
|
|
|
|
|
|
|
|
|
|
|
|
|
|
|
|
|
|
|
|
|
|
|
|
|
|
|
|
|
|
|
|
|
|
|
|
|
|
|
|
|
|
| Wyoming severance tax |
| US$ 000s |
| $ | (16,321 | ) |
| $ | (1.30 | ) |
| $ | (96 | ) |
| $ | (1,223 | ) |
| $ | (1,413 | ) |
| $ | (1,236 | ) |
| $ | (1,313 | ) |
| $ | (1,402 | ) |
| $ | (1,274 | ) |
| $ | (1,448 | ) |
| $ | (1,379 | ) |
| $ | (1,382 | ) |
| $ | (1,396 | ) |
| $ | (1,389 | ) |
| $ | (1,162 | ) |
| $ | (202 | ) |
| $ | (6 | ) |
| $ | - |
|
| $ | - |
|
| $ | - |
|
| $ | - |
|
| $ | - |
|
| Sweetwater ad valorem tax |
| US$ 000s |
| $ | (27,598 | ) |
| $ | (2.20 | ) |
| $ | (163 | ) |
| $ | (2,068 | ) |
| $ | (2,389 | ) |
| $ | (2,090 | ) |
| $ | (2,220 | ) |
| $ | (2,370 | ) |
| $ | (2,154 | ) |
| $ | (2,448 | ) |
| $ | (2,332 | ) |
| $ | (2,336 | ) |
| $ | (2,361 | ) |
| $ | (2,349 | ) |
| $ | (1,965 | ) |
| $ | (342 | ) |
| $ | (9 | ) |
| $ | - |
|
| $ | - |
|
| $ | - |
|
| $ | - |
|
| $ | - |
|
| Operating costs (see Table 10) |
| US$ 000s |
| $ | (205,055 | ) |
| $ | (16.34 | ) |
| $ | (8,099 | ) |
| $ | (13,938 | ) |
| $ | (13,562 | ) |
| $ | (14,780 | ) |
| $ | (12,513 | ) |
| $ | (12,401 | ) |
| $ | (13,817 | ) |
| $ | (15,109 | ) |
| $ | (13,326 | ) |
| $ | (11,939 | ) |
| $ | (14,940 | ) |
| $ | (14,653 | ) |
| $ | (10,891 | ) |
| $ | (7,228 | ) |
| $ | (3,114 | ) |
| $ | (5,766 | ) |
| $ | (3,693 | ) |
| $ | (1,318 | ) |
| $ | (12,672 | ) |
| $ | (1,287 | ) |
| Wellfield Development |
| US$ 000s |
| $ | (151,733 | ) |
| $ | (12.09 | ) |
| $ | (11,920 | ) |
| $ | (9,358 | ) |
| $ | (12,437 | ) |
| $ | (13,291 | ) |
| $ | (17,321 | ) |
| $ | (16,143 | ) |
| $ | (12,077 | ) |
| $ | (10,697 | ) |
| $ | (13,192 | ) |
| $ | (15,426 | ) |
| $ | (10,425 | ) |
| $ | (8,062 | ) |
| $ | (1,384 | ) |
| $ | - |
|
| $ | - |
|
| $ | - |
|
| $ | - |
|
| $ | - |
|
| $ | - |
|
| $ | - |
|
| Exploration cost |
| US$ 000s |
| $ | - |
|
| $ | - |
|
| $ | - |
|
| $ | - |
|
| $ | - |
|
| $ | - |
|
| $ | - |
|
| $ | - |
|
| $ | - |
|
| $ | - |
|
| $ | - |
|
| $ | - |
|
| $ | - |
|
| $ | - |
|
| $ | - |
|
| $ | - |
|
| $ | - |
|
| $ | - |
|
| $ | - |
|
| $ | - |
|
| $ | - |
|
| $ | - |
|
| Sweetwater property tax |
| US$ 000s |
| $ | (1,148 | ) |
| $ | (0.09 | ) |
| $ | (155 | ) |
| $ | (153 | ) |
| $ | (140 | ) |
| $ | (127 | ) |
| $ | (114 | ) |
| $ | (102 | ) |
| $ | (89 | ) |
| $ | (76 | ) |
| $ | (64 | ) |
| $ | (51 | ) |
| $ | (38 | ) |
| $ | (26 | ) |
| $ | (13 | ) |
| $ | (2 | ) |
| $ | - |
|
| $ | - |
|
| $ | - |
|
| $ | - |
|
| $ | - |
|
| $ | - |
|
| Working capital changes |
| US$ 000s |
| $ | - |
|
| $ | - |
|
| $ | - |
|
| $ | - |
|
| $ | (6,168 | ) |
| $ | 6,168 |
|
| $ | - |
|
| $ | (6,304 | ) |
| $ | 6,304 |
|
| $ | (6,488 | ) |
| $ | (115 | ) |
| $ | - |
|
| $ | - |
|
| $ | - |
|
| $ | 6,604 |
|
| $ | - |
|
| $ | - |
|
| $ | - |
|
| $ | - |
|
| $ | - |
|
| $ | - |
|
| $ | - |
|
| Project cash flow |
| US$ 000s |
| $ | 396,305 |
|
| $ | 31.59 |
|
| $ | (5,193 | ) |
| $ | 31,800 |
|
| $ | 31,739 |
|
| $ | 30,534 |
|
| $ | 29,189 |
|
| $ | 30,622 |
|
| $ | 34,336 |
|
| $ | 35,070 |
|
| $ | 35,628 |
|
| $ | 34,904 |
|
| $ | 36,880 |
|
| $ | 39,561 |
|
| $ | 50,625 |
|
| $ | 5,434 |
|
| $ | (77 | ) |
| $ | (5,766 | ) |
| $ | (3,693 | ) |
| $ | (1,318 | ) |
| $ | (12,672 | ) |
| $ | (1,287 | ) |
|
|
|
|
|
|
|
|
|
|
|
|
|
|
|
|
|
|
|
|
|
|
|
|
|
|
|
|
|
|
|
|
|
|
|
|
|
|
|
|
|
|
|
|
|
|
|
|
|
|
|
|
|
|
|
|
|
|
|
|
|
|
|
|
|
|
|
|
|
|
|
|
|
|
|
|
|
|
|
|
|
|
|
|
|
|
|
|
|
|
|
|
| Initial capital |
| US$ 000s |
| $ | - |
|
| $ | - |
|
| $ | - |
|
| $ | - |
|
| $ | - |
|
| $ | - |
|
| $ | - |
|
| $ | - |
|
| $ | - |
|
| $ | - |
|
| $ | - |
|
| $ | - |
|
| $ | - |
|
| $ | - |
|
| $ | - |
|
| $ | - |
|
| $ | - |
|
| $ | - |
|
| $ | - |
|
| $ | - |
|
| $ | - |
|
| $ | - |
|
| Sustaining capital |
| US$ 000s |
| $ | (19,878 | ) |
| $ | (1.58 | ) |
| $ | (16,295 | ) |
| $ | (339 | ) |
| $ | (117 | ) |
| $ | (2 | ) |
| $ | (109 | ) |
| $ | (304 | ) |
| $ | (1,002 | ) |
| $ | (310 | ) |
| $ | (264 | ) |
| $ | (79 | ) |
| $ | (514 | ) |
| $ | (336 | ) |
| $ | (17 | ) |
| $ | (2 | ) |
| $ | (26 | ) |
| $ | (118 | ) |
| $ | (32 | ) |
| $ | - |
|
| $ | (11 | ) |
| $ | - |
|
| Net cash flow before tax |
| US$ 000s |
| $ | 376,427 |
|
| $ | 30.00 |
|
| $ | (21,488 | ) |
| $ | 31,461 |
|
| $ | 31,622 |
|
| $ | 30,532 |
|
| $ | 29,080 |
|
| $ | 30,318 |
|
| $ | 33,334 |
|
| $ | 34,760 |
|
| $ | 35,364 |
|
| $ | 34,825 |
|
| $ | 36,366 |
|
| $ | 39,225 |
|
| $ | 50,608 |
|
| $ | 5,432 |
|
| $ | (103 | ) |
| $ | (5,884 | ) |
| $ | (3,725 | ) |
| $ | (1,318 | ) |
| $ | (12,683 | ) |
| $ | (1,287 | ) |
|
|
|
|
|
|
|
|
|
|
|
|
|
|
|
|
|
|
|
|
|
|
|
|
|
|
|
|
|
|
|
|
|
|
|
|
|
|
|
|
|
|
|
|
|
|
|
|
|
|
|
|
|
|
|
|
|
|
|
|
|
|
|
|
|
|
|
|
|
|
|
|
|
|
|
|
|
|
|
|
|
|
|
|
|
|
|
|
|
|
|
|
| Federal income tax |
| US$ 000s |
| $ | (77,108 | ) |
| $ | (6.15 | ) |
| $ | - |
|
| $ | - |
|
| $ | - |
|
| $ | - |
|
| $ | (2,016 | ) |
| $ | (8,623 | ) |
| $ | (7,187 | ) |
| $ | (10,455 | ) |
| $ | (8,746 | ) |
| $ | (8,167 | ) |
| $ | (9,457 | ) |
| $ | (10,058 | ) |
| $ | (10,792 | ) |
| $ | (1,607 | ) |
| $ | - |
|
| $ | - |
|
| $ | - |
|
| $ | - |
|
| $ | - |
|
| $ | - |
|
| State income tax |
| US$ 000s |
| $ | (32,265 | ) |
| $ | (2.57 | ) |
| $ | - |
|
| $ | - |
|
| $ | (553 | ) |
| $ | (2,327 | ) |
| $ | (2,466 | ) |
| $ | (3,091 | ) |
| $ | (2,577 | ) |
| $ | (3,748 | ) |
| $ | (3,136 | ) |
| $ | (2,928 | ) |
| $ | (3,390 | ) |
| $ | (3,606 | ) |
| $ | (3,869 | ) |
| $ | (576 | ) |
| $ | - |
|
| $ | - |
|
| $ | - |
|
| $ | - |
|
| $ | - |
|
| $ | - |
|
| Net cash flow after tax |
| US$ 000s |
| $ | 267,054 |
|
| $ | 21.29 |
|
| $ | (21,488 | ) |
| $ | 31,461 |
|
| $ | 31,069 |
|
| $ | 28,205 |
|
| $ | 24,598 |
|
| $ | 18,604 |
|
| $ | 23,570 |
|
| $ | 20,557 |
|
| $ | 23,482 |
|
| $ | 23,730 |
|
| $ | 23,519 |
|
| $ | 25,561 |
|
| $ | 35,947 |
|
| $ | 3,249 |
|
| $ | (103 | ) |
| $ | (5,884 | ) |
| $ | (3,725 | ) |
| $ | (1,318 | ) |
| $ | (12,683 | ) |
| $ | (1,287 | ) |
| 1. | Production is based on an approximate 80% recovery of the total of Measured, Indicated and Inferred resources (per 17 CFR §229.1300, as well as NI 43-101 Section 2.3(3)) in the 12 RAs of the MMT and EMT. |
| 2. | Uranium price is the annual average of the projections of reports prepared by VIII Capital Corp., November 4, 2021; Cantor Fitzgerald Canada Corporation, October 18, 2021; H.C. Wainwright & Co., September 29, 2021; and UxC, LLC, December 6, 2021, as discussed in Chapter 16. |
| 3. | All amounts in US $ 000s. |
| 4. | Wellfield Development includes wellfield drilling, wellfield construction costs, and costs for installing one proposed disposal well. |
| 5. | Working capital changes are primarily related to annual cash flow timing differences in accounts receivable and accounts payable and totals to zero. |
| 6. | Pounds sold exceeds pounds produced due to existing inventories. |
| Ur-Energy – Lost Creek ISR Uranium Property Amended Technical Report Summary – September 19, 2022 | Page 94 |
|
|
|
Table 13. Net Present Value Discount Rate Sensitivity and IRR
| NPV Discount Rates and IRR |
| Units |
| Pre-income Tax |
|
| Post-income Tax |
| ||
| NPV @ 5% |
| US$ 000s |
| $ | 259,565 |
|
| $ | 189,900 |
|
| NPV @ 8% |
| US$ 000s |
| $ | 210,894 |
|
| $ | 156,790 |
|
| NPV @ 10% |
| US$ 000s |
| $ | 184,780 |
|
| $ | 138,749 |
|
| IRR (adjusted for Undepreciated Initial Capital) 1 |
| % |
|
| 72.2 | % |
|
| 66.8 | % |
| 1. | As of December 31, 2021, Lost Creek had $27.4 million of undepreciated, initial capital assets that will be charged against operations over time. By including the undepreciated, initial capital assets, an IRR can be calculated. Without these costs, an IRR cannot be calculated. |
| 2. | The NPV and IRR calculations are based on Year 2022 to Year 2041 and excludes any sunk costs which occurred prior to 2022. |
19.3 Taxation
The economic analyses presented herein provide the results of the analyses for pre-income tax and post-income tax, which includes U.S. federal and Illinois state income taxes. There is no State of Wyoming income tax and all sales are assumed to take place in Illinois where the conversion facility is located. The only difference between the two scenarios is the value of the estimated income taxes. All other sales, property, use, severance and conservations taxes as well as royalties are included in both scenarios. The current Wyoming severance tax rate for uranium is 4 percent, but after the well head deduction it is approximately 2.0 percent of gross sales. The current ad valorem tax rate for uranium is about 6.8 percent but after the well head deduction is approximately 3.5 percent of gross sales. In aggregate and based on the taxable portion of the product, the total tax averages approximately 5.5 percent of gross sales. At the federal level, profit from mining ventures is taxable at corporate income tax rates. For mineral properties, depletion tax credits are available on a cost or percentage basis, whichever is greater.
The Property economic analysis includes tax estimates for state severance taxes, county ad valorem taxes and property taxes, all of which are directly attributable to the Property. Ur-Energy USA Inc. files consolidated federal tax returns in the U.S. and had approximately $105.6 million in tax loss carry forwards as of December 31, 2021. URE does not anticipate paying any significant federal income taxes until the existing, and any future, tax loss carry forwards are utilized. In addition, reclamation costs can be deducted in the early years of the Property, thus also pushing out the tax liability.
19.4 Sensitivity Analysis
The Property is sensitive to changes in the price of uranium as shown in Figures 16 and 17. A five percent change in the spot commodity price results in a $21.8 million change to the pre-tax NPV and $14.3 Million to the post tax NPV at a discount rate of eight percent. This analysis is based on a variable commodity price per pound. The Property is also slightly sensitive to changes in OPEX costs. A five percent variation in OPEX results in a $5.5 million variation in pre-tax NPV and $3.6 million to the post-tax NPV. A five percent variation in CAPEX results in a $0.8 million variation the pre-tax NPV and $0.6 million to the post-tax NPV. This analysis is based on an eight percent discount rate and a variable commodity price per pound.
| Ur-Energy – Lost Creek ISR Uranium Property Amended Technical Report Summary – September 19, 2022 | Page 95 |
|
|
|
Figure 16. Pre-tax NPV Sensitivity to Price, OPEX and CAPEX
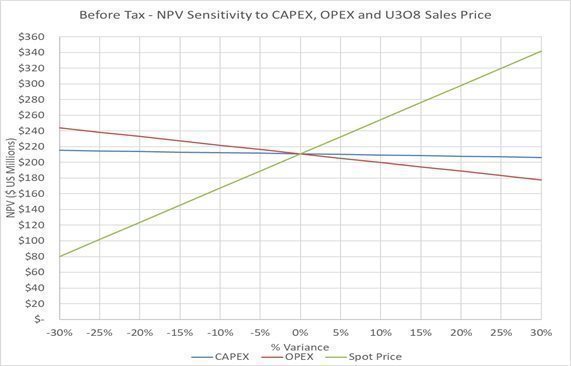
Figure 17. Post-Tax NPV Sensitivity to Price, OPEX and CAPEX
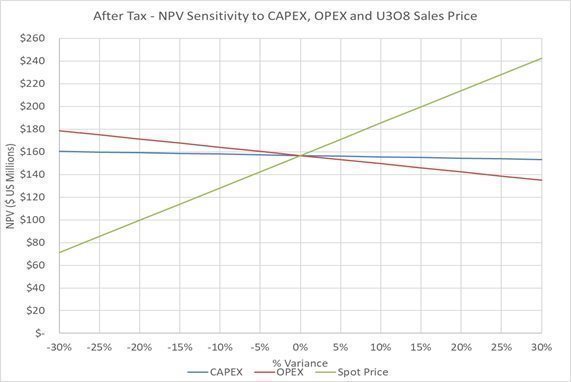
| Ur-Energy – Lost Creek ISR Uranium Property Amended Technical Report Summary – September 19, 2022 | Page 96 |
|
|
|
20.0 ADJACENT PROPERTIES
Adjacent Properties refers to non-URE uranium properties of interest in close proximity to the Property and should not be confused with the term Adjoining Projects referring to projects which are a part of the Property. There have been several historical conventional uranium mills and mines and one historical ISR project (Bison Basin Project) in the Great Divide Basin (Figure 2). Most significant of these is the Sweetwater Mine and Mill, now owned by Rio Tinto Americas, Inc. (Figure 2). The facility lies about three and one-half miles south of the southwestern-most boundary of the Lost Creek Project and consists of a conventional uranium mill and reclaimed open-pit mine, both of which are currently non-operational. The deposit was discovered in the 1970s by Minerals Exploration Company. Original estimates of resources were as much as 15 million pounds at an average grade of 0.046 percent eU3O8 (Sherborne, et al., 1981). This is an historical estimate derived before Committee for Mineral Reserves International Reporting Standards were developed, including under NI 43-101, and reliability of the estimate has not been independently verified. Production ceased in approximately 1982 after yielding 1.29 million pounds of U3O8.
In addition to historic mines, there are numerous exploration projects held by other companies in the GDB. None of these projects is slated for production soon and their owners are not currently seeking permits to mine. The most relevant project is the Jab/Antelope Project located just north of the Lost Creek Property. The Jab/Antelope Project was recently acquired by Uranium Energy Corporation.
21.0 OTHER RELEVANT DATA AND INFORMATION
There is no other relevant data or information to include.
| Ur-Energy – Lost Creek ISR Uranium Property Amended Technical Report Summary – September 19, 2022 | Page 97 |
|
|
|
22.0 INTERPRETATION AND CONCLUSIONS
This Report for the Property has been prepared for URE and its subsidiary, LC, by WWC, in accordance with the guidelines set forth in S-K 1300. Its objective is to disclose current mineral resources for the Property, and to evaluate the possible economic viability of the Property.
The Lost Creek Project is in production. However, as of December 31, 2021, operations consisted primarily of maintaining minimum bleed requirements in the wellfields due to depressed uranium prices. The plant and wellfields remain fully operational in order to take advantage of improving uranium prices. Construction of the Lost Creek plant and installation of MU1 was initiated in October 2012. Production operations in MU1 within the HJ Horizon began on August 2, 2013. From the beginning of operations through December 31, 2021, 2.735 million pounds U3O8 have been produced and captured. All the wells to support 13 HHs of MU1 and the first three HHs of MU2 have been completed.
Additionally, amendments to the license and permits have been obtained or are expected to be obtained in 2022 for authorization to commence production operations at the LC East Project and recover uranium from that Project and additional HJ horizon mine units at the Lost Creek Project.
22.1 Conclusions
The QP has weighed the potential benefits and risks presented in this Report and have found the Property to be potentially viable and meriting further operations, production, evaluation, and exploration.
22.2 Risk Assessment
22.2.1 Resource and Recovery
Bench-scale tests have been performed on various core samples from the Property and production in MU1 began in August 2013 and continues to date in MU1 and MU2. The most significant potential risks to meeting the production results presented in this Report will be associated with the success of the wellfield operation, recovery of uranium from the targeted host sands, and disposal of wastewater.
The estimated quantity of recovered uranium used in this Report is based primarily on the recovery data from wellfield operations to date. The recovery factor of 80 percent, used here, is also relatively typical of industry experience for wellfield recovery. As stated earlier, recoveries in some of the production units have exceeded resource estimates. The QP can provide no assurance that recovery of the resources seen in early production will be demonstrated in future mine units. This Report is based on the assumptions and information presented herein.
Another potential concern is reduced hydraulic conductivity in the formation due to chemical precipitation or lower hydraulic conductivities than estimated. Early production data supports lower-than-anticipated injection rates that are offset by higher-than-expected production grades. The risks associated with these potential issues have been minimized to the extent possible by extensive delineation, site hydraulic studies, and permitting of future wastewater capacity.
| Ur-Energy – Lost Creek ISR Uranium Property Amended Technical Report Summary – September 19, 2022 | Page 98 |
|
|
|
Production rates may also be limited by wastewater disposal capacity. The two operational DDWs installed to date are operated intermittently to support production operations. Two additional DDWs have been permitted and one is modeled to be installed in the future to support operations. To alleviate disposal capacity risks URE has begun treating bleed water with reverse osmosis and subjected the resultant permeate to a radium removal process prior to re-injecting in Class V wells. This disposal method has been successful thus far and has increased URE’s disposal capacity.
The resources contained within the HJ horizon in the northern extremes of the LC East Project are shallow and portions of the aquifer is unconfined. The limited hydraulic head over the resources may make ISR extraction of HJ mineralization difficult in this area. As shown on Figure 9, only a very small portion of the HJ resources is located in the northern portion of LC East. The reduced head above the resource only affects a very small percentage of the LC East resources and is not expected to significantly impact total recoveries. Furthermore, there is currently no planned HJ RA in this portion of LC East and potential mining activity here will be focused in the KM Horizon, which remains under suitably confined groundwater conditions.
22.2.2 Markets and Contracts
The marketability of uranium and acceptance of uranium mining are subject to numerous factors beyond the control of URE. The price of uranium may experience volatile and significant price movements over short periods of time. Factors beyond our control affect the market, including demand for nuclear power; changes in public acceptance of nuclear power generation; political and economic conditions in uranium mining, producing and consuming countries; costs and availability of financing of nuclear plants; changes in governmental regulations; global or regional consumption patterns; speculative activities and increased production due to new extraction developments and improved production methods; the future viability and acceptance of small modular reactors or micro-reactors and the related fuel requirements for this new technology; reprocessing of spent fuel and the re-enrichment of depleted uranium tails or waste; and global economics, including currency exchange rates, interest rates and expectations of inflation. Any future accidents, or threats of or incidents of war, civil unrest or terrorism, at nuclear facilities are likely to also impact the conditions of uranium mining and the use and acceptance of nuclear energy.
Unlike other commodities, most uranium does not trade on an open market. Contracts are negotiated privately by buyers and sellers. Changes in the price of uranium can have a significant impact on the economic performance of the Property. As discussed previously, a five percent change in the spot commodity price results in a $21.8 million change to the NPV (pre-income tax) at a discount rate of eight percent This economic analysis assumes U3O8 production is sold at a variable price per pound for the life of the Property ranging from $50.80 to $66.04. This price is based on the annual average of the projections prepared by four independent financial firms: from expert market analysts at institutions including VIII Capital Corp. (2021); Cantor Fitzgerald Canada Corporation (2021); H.C. Wainwright & Co. (2021); and UxC, LLC (2021) (See also Chapter 16). The QP believes these estimates were appropriate for use in the evaluation.
| Ur-Energy – Lost Creek ISR Uranium Property Amended Technical Report Summary – September 19, 2022 | Page 99 |
|
|
|
22.2.3 Operations
Some operational risks such as reagents, power, labor and/or material cost fluctuations exist in the Property operation and could impact the OPEX and Property economic performance. These potential risks are generally considered to be addressable either though wellfield modifications or plant optimization. The plant has been constructed as a batch precipitation and drying operation, which allows for process variations and enhanced control.
The IX and elution processes have been, and are being used not only at Lost Creek, but at other ISR facilities in Wyoming, Texas, and Nebraska. The process does not use any unusual methods and the reagents for the process are readily available from regional sources. Process optimization to minimize the use of reagents, minimize loss of product and ensure proper product quality is ongoing.
Health and safety programs have been implemented to control the risk of on- and off-site exposures to uranium, operational incidents and/or process chemicals. Standard industry practices exist for this type of operation and novel approaches to risk control and management are not required.
| Ur-Energy – Lost Creek ISR Uranium Property Amended Technical Report Summary – September 19, 2022 | Page 100 |
|
|
|
23.0 RECOMMENDATIONS
The QP finds the Property is potentially viable based on the assumptions contained herein. There is no certainty that the mineral recovery or the economics presented here will be realized. The following recommendations are limited due to the fact that this Report describes the Property which, at this time, is primarily focused on production and development activities, including the final aspects of permitting for the LC East Project. Additional operational refinements are ongoing as part of routine operation activities, and exploration activities and engineering studies related to the MMT and EMT have largely concluded. Wellfield development and permitting activities, below, are not conditional on one another and should continue concurrently.
23.1 Continued Wellfield Development
To realize the full potential benefits described in this Report, all aspects of operations and further wellfield development should be continued as market conditions warrant. Wellfields must be developed in advance of future production including further development of MU2 and MU1 as well as future wellfields in other RAs. Data obtained from wellfield development should be used to continue to reconcile and improve the Property mineral resource estimate. Wellfield development costs are based upon operations to date and are included in the OPEX and CAPEX estimates and financial projections presented herein.
URE should continue to advance other adjoining projects as necessary to mine uranium at the Property.
URE should continue with its pre-construction design and engineering work related to wastewater management processes and procedures with the goal of concentrating and minimizing RO brine production and maximizing permeate output. Further costs for this continued design and engineering work are estimated to be $0.2 million.
23.2 Continued Permitting
URE should complete the permit amendment process for the remaining required permit and approvals for additional HJ production at Lost Creek and production from the HJ and KM horizons at LC East.
| Ur-Energy – Lost Creek ISR Uranium Property Amended Technical Report Summary – September 19, 2022 | Page 101 |
|
|
|
24.0 REFERENCES
Bailey R.G., 1995, Descriptions of the Ecoregions of the United States. USDA Forest Service Miscellaneous Publication 1391: 108.
Bureau of Land Management (BLM), 2003, Supplement to Memorandum of Understanding No. WY 19 between the United States Department of the Interior Bureau of Land Management and the Wyoming Department of Environmental Quality Land Quality Division for Management of Surface Mining and Exploration for Locatable Minerals on Public Lands, November 10, 2003. Electronic copy only, available on request from BLM.
Bureau of Land Management (BLM), 2018, Lost Creek Uranium In-Situ Recovery Project Modifications, Draft Environmental Impact Statement, Rawlins Bureau of Land Management Field Office, August, 2018.
Boberg W.W., 2010, The Nature and Development of the Wyoming Uranium Province. SEG Special Publication 15, pp. 653-674.
Cantor Fitzgerald Canada Corporation (2021) Uranium Macro Update: Kazatomprom Joins the Party, Raising Uranium Spot and Term Price Forecasts. October 18, 2021.
CIM Council, 2003, Estimation of Mineral Resources and Mineral Reserves, Best Practice Guidelines, Uranium Specific Guidelines. https://mrmr.cim.org/media/1040/best-practices-in-uranium-estimation-guidelines.pdf [online document]. Last Accessed March 2022
CIM Council, 2014, CIM Definition Standards For Mineral Resources and Mineral Reserves https://mrmr.cim.org/media/1128/cim-definition-standards_2014.pdf [online document]. Last accessed March 2022.
CPI, 2021, Consumer price Index Data, online database accessed at https://www.usinflationcalculator.com/inflation/, available as of February 2022.
Collentine M., Libra R., Feathers K., Hamden L., 1981, Occurrence and characteristics of ground water in the Great Divide and Washakie Basins, Wyoming. Wyoming Water Research Institute. Technical Report Vol. VI-A.
Curtis J.C. and Grimes K., 2004, Wyoming Climate Atlas. Wyoming State Climate Office. No. 1.2.1 http://www.wrds.uwyo.edu/sco/climateatlas/title_page.html [website]. Last accessed March 2022.
FRED, 2021, FRED Online Economic Data, Online database located at: https://fred.stlouisfed.org/series/GDPDEF available as of February 2022
Fisk E.P., 1967, Groundwater geology and hydrology of the Great Divide and Washakie Basins, south-central Wyoming [master’s thesis]. [Los Angeles (CA)]: University of Southern California.
Hazen, 2007, Characterization of Uranium Occurrence in Sandstone Samples [Ur-Energy], Hazen Project 10619. August 24, 2007.
H.C. Wainwright & Co. (2021) Uranium Price Deck Revision; Operational Readiness in Light of Recent Sector Developments; Reiterate Buy; PT Higher. September 29, 2021.
Honea R., 1979a, TT-147 Petrographic Report. Report ID: URLC4.
| Ur-Energy – Lost Creek ISR Uranium Property Amended Technical Report Summary – September 19, 2022 | Page 102 |
|
|
|
Honea R., 1979b, Lost Creek – Honea Petrographic Description TT-152. Report ID: NF LC-1121. Hydro-Engineering, LLC, 2007, Lost Creek aquifer test analyses. Prepared for Ur-Energy USA
Inc. March 2007.
Hydro-Search, Inc. 1982, 1982 Hydrogeology program for the Conoco/Lost Creek uranium project. Golden (CO). Prepared for Texasgulf, Inc.
Lyntek, Inc., 2008, Amended NI-43-101 Preliminary Assessment for the Lost Creek Project Sweetwater County, Wyoming. John I Kyle P.E., Douglas K. Maxwell P.E., April 2nd, 2008, as amended February 25, 2011 (As amended, with C. Stewart Wallis, P.Geo., co-author).
Maxim Technologies, Inc. / Tetra Tech Inc. 2005a, Geotechnical Test Summary. Prepared for Ur- Energy by Energy Laboratories, Inc. Project Number 6550913. Report Number 8468. October 24, 2005.
Maxim Technologies, Inc. / Tetra Tech Inc. 2005b, Geotechnical Test Summary. Prepared for Ur- Energy Inc. by Energy Laboratories, Inc. Project Number 6550913. Report Number 8519. December 8, 2005.
Maxim Technologies, Inc. / Tetra Tech Inc. 2006, Geotechnical Test Summary. Prepared for Ur- Energy Inc. by Energy Laboratories, Inc. Project Number 6550913. Report Number 8547. January 5, 2006.
Office of the Governor, 2015, State of Wyoming Executive Department Executive Order 2015-4, Greater Sage-Grouse Core Area Protection, July 29, 2015, Available on the Internet as of January 2017:
Petrotek Engineering Corporation, 2007, “Lost Creek Regional Hydrologic Testing Report – Lost Creek Project Sweetwater County, Wyoming”. Report by Petrotek Engineering Corporation, October 2007.
Petrotek Engineering Corporation, 2009, Lost Creek Regional Hydrologic Testing Report – Mine Unit 1, North and South Tests; prepared for Lost Creek ISR, LLC, October 2009.
Petrotek Engineering Corporation, 2013, Lost Creek Hydrologic Test, Composite KLM Horizon 5- Spot Testing, October 2012; prepared for Lost Creek ISR, LLC, April 2013.
Roscoe Postle Associates (RPA), 2005, Technical Report on the Great Divide Basin Uranium Properties, Wyoming, Prepared for Ur-Energy Inc.; Stewart Wallis, June 15, 2005, Revised October 15, 2005.
Roscoe Postle Associates (RPA), 2006, Technical Report on the Lost Creek Project, Wyoming, NI 43-101 Prepared for Ur-Energy Inc.; Stewart Wallis, June 15, 2006.
Rubin, B., 1970, Uranium Roll-Front Zonation in the Southern Powder River Basin, Wyoming: Wyoming Geological Society Earth Science Bull., Vol. 3, No. 4.
Sherborne, J.E., Jr.; Pavlak, S.J.; Peterson, C.H.; and Buckovic, W.A. 1981, Uranium Deposits of the Sweetwater Mine Area, Great Divide Basin, Wyoming: Third Annual Uranium Seminar, AIME, pp.27-37].
TREC, Inc., March 16, 2011, Preliminary Economic Assessment, Lost Creek Property, Sweetwater County, Wyoming.
TREC, Inc., December 31, 2013, Preliminary Economic Assessment, Lost Creek Property, Sweetwater County, Wyoming.
| Ur-Energy – Lost Creek ISR Uranium Property Amended Technical Report Summary – September 19, 2022 | Page 103 |
|
|
|
TREC, Inc., June 17, 2015, Technical Report, Lost Creek Property, Sweetwater County, Wyoming
TREC, Inc., February 8, 2016 Amended Preliminary Economic Assessment of the Lost Creek Property Sweetwater County, Wyoming.
Ur-Energy Inc., 2007a, Lost Creek ISR, LLC, Lost Creek ISR Project, Wyoming DEQ Permit to Mine.
Mine Application, December, 2007.Ur-Energy Inc., 2007b, Lost Creek ISR, LLC, Application for US NRC Source and Byproduct Material License (Docket No. 40-9068), Technical Report, October, 2007.
Ur-Energy Inc., 2012a, Preliminary Economic Assessment of the Lost Creek Property, Sweetwater County, Wyoming, February 29, 2012.
Ur-Energy Inc., 2012b Preliminary Economic Assessment of the Lost Creek Property, Sweetwater County, Wyoming, April 30, 2012.
Ur-Energy Inc., 2014a, Lost Creek ISR, LLC, Permit amendment for LC East Project, Wyoming DEQ Permit to Mine Application, September 2014.
Ur-Energy Inc., 2014b, Lost Creek ISR, LLC, Permit amendment for the KM Horizon at the Lost Creek ISR Project, Wyoming DEQ Permit to Mine Application, September 2014.
UR-Energy Inc., 2017, KM and LC East Amendment Source Material License Application NRC License SUA-1598, Docket 040-09068, BLM WYW-166318, February 27, 2017.
U.S. Census Bureau 2020 Report (updated through 2021) on Carbon County, WY https://www.census.gov/quickfacts/fact/table/carboncountywyoming/HSD410219#HSD410219 [website]. Last accessed February 2022.
U.S. Census Bureau 2020 (updated through 2021) Report on Sweetwater County, WY https://www.census.gov/quickfacts/fact/table/sweetwatercountywyoming/HSG6502199 [website]. Last accessed February 2022.
U.S. Fish and Wildlife Service (USFWS), 2015, IPaC Trust Resource Report – Sweetwater County. Electronic Copy Only. Available on request from BLM.
U.S. Fish and Wildlife Service (USFWS), 2017, List of Threatened and Endangered Species for the Lost Creek ISR Project Area, Letter dated September 25, 2017. Electronic copy only, available on request from BLM.
UxC, LLC. (2021) Uranium Market Outlook Q4 2021. December 6, 2021
VIII Capital Corp (2021) Uranium: Raising Price forecasts and Our Five Most Important Slides. November 4, 2021.
Weatherford, 2010, Summary of Routine Core Analysis Results. Prepared for Ur-Energy USA Inc. by Energy Laboratories, Inc. Report Number C10010037. March 1, 2010.
Welder, G.E. and McGreevey L.J., 1966, Groundwater Reconnaissance of the Great Divide and Washakie Basins and Some Adjacent Areas, Southwestern Wyoming: U.S. Geol. Survey Hydro. Investigations Atlas HA-219, 10 pages, 3 Sheets.
Wyoming Game and Fish Department (WGFD), 2018, Letter to John Cash (Lost Creek ISR, LLC) from Angi Bruce (WGFD), August 20, 2018. WER 2792.08b State of Wyoming’s Sage Grouse Executive Order 2015-4 Density Disturbance Calculation Tool. Electronic copy only, available on request from BLM.
| Ur-Energy – Lost Creek ISR Uranium Property Amended Technical Report Summary – September 19, 2022 | Page 104 |
|
|
|
25.0 RELIANCE ON INFORMATION PROVIDED BY THE REGISTRANT
For this Report, the QP has relied on information provided by URE regarding property ownership, title and mineral rights in light of reviews by mineral title specialists retained from time to time by URE, regulatory and environmental information, capital expenditures, operating expenditures and estimated commodity sales prices. Additionally, this Report was prepared by the QP with reliance on reports and information from others as cited throughout this Report and as referenced in Chapter 16.0 (Market Studies) and Chapter 24.0 (References).
26.0 DATE AND SIGNATURE PAGES
CERTIFICATE OF Author
Western Water Consultants, Inc., d/b/a WWC Engineering (WWC), of 1849 Terra Avenue, Sheridan, Wyoming, USA do hereby certify that:
|
| · | WWC is an independent, third-party engineering firm comprised of mining experts, such as professional geologists, professional mining engineers and certified environmental scientists. |
|
|
|
|
|
| · | WWC has read the definition of “qualified person” set out in S-K 1300 and certify that by reason of education, professional registration, and relevant work experience, WWC professionals fulfill the requirements to be a “qualified person” for the purposes of S-K 1300. |
Western Water Consultants, Inc., d/b/a WWC Engineering
(“Signed and Sealed”) Western Water Consultants, Inc.
September 19, 2022
| Ur-Energy – Lost Creek ISR Uranium Property Amended Technical Report Summary – September 19, 2022 | Page 105 |