UR-ENERGY INC.
ANNUAL REPORT ON FORM 10-K
TABLE OF CONTENTS
2
When we use the terms “Ur-Energy,” “we,” “us,” or “our,” or the “Company” we are referring to Ur-Energy Inc. and its subsidiaries, unless the context otherwise requires. We have included technical terms important to an understanding of our business under “Glossary of Common Terms” at the end of this section. Throughout this document we make statements that are classified as “forward-looking.” Please refer to the “Cautionary Statement Regarding Forward-Looking Statements” section of this document for an explanation of these types of assertions.
Cautionary Statement Regarding Forward-Looking Information
This annual report on Form 10-K contains "forward-looking statements" within the meaning of applicable United States and Canadian securities laws, and these forward-looking statements can be identified by the use of words such as "expect", "anticipate", "estimate", "believe", "may", "potential", "intends", "plans" and other similar expressions or statements that an action, event or result "may", "could" or "should" be taken, occur or be achieved, or the negative thereof or other similar statements. These statements are only predictions and involve known and unknown risks, uncertainties and other factors which may cause our actual results, performance or achievements, or industry results, to be materially different from any future results, performance, or achievements expressed or implied by these forward-looking statements. Such statements include, but are not limited to: (i) our timeline for full ramp up of production operations to design capacity at our Lost Creek project; (ii) the technical and economic viability of Lost Creek; (iii) our ability to complete additional favorable uranium sales agreements including spot sales if production is available and the market warrants; (iv) the production rates and life of the Lost Creek Project and subsequent production from adjoining properties, including LC East; (v) the potential of exploration targets throughout the Lost Creek Property (including the ability to expand resources); (vi) the potential of our other exploration and development projects, including Shirley Basin, as well as the technical and economic viability of Shirley Basin; (vii) the timing and outcome of environmental baseline studies at Shirley Basin; (viii) the outcome of our 2015 forecast, and production projections; and (ix) the continuing and long-term effects on the uranium market of events in Japan in 2011 including supply and demand projections. These other factors include, among others, the following: future estimates for production, production ramp-up and operations (including any difficulties with continued ramp up), capital expenditures, operating costs, mineral resources, recovery rates, grades and prices; business strategies and measures to implement such strategies; competitive strengths; estimates of goals for expansion and growth of the business and operations; plans and references to our future successes; our history of operating losses and uncertainty of future profitability; status as an exploration stage company; the lack of mineral reserves; risks associated with obtaining permits in the United States; risks associated with current variable economic conditions; our ability to service our debt and maintain compliance with all restrictive covenants related to the debt facilities and security documents; the possible impact of future financings; the hazards associated with mining production; compliance with environmental laws and regulations; uncertainty regarding the pricing and collection of accounts; the possibility for adverse results in pending and potential litigation; uncertainties associated with changes in government policy and regulation; uncertainties associated with a Canada Revenue Agency or U.S. Internal Revenue Service audit of any of our cross border transactions; adverse changes in general business conditions in any of the countries in which we do business; changes in size and structure; the effectiveness of management and our strategic relationships; ability to attract and retain key personnel; uncertainties regarding the need for additional capital; uncertainty regarding the fluctuations of quarterly results; foreign currency exchange risks; ability to enforce civil liabilities under U.S. securities laws outside the United States; ability to maintain our listing on the NYSE MKT LLC (“NYSE MKT”) and Toronto Stock Exchange (“TSX”); risks associated with the expected classification as a "passive foreign investment company" under the applicable provisions of the U.S. Internal Revenue Code of 1986, as amended; risks associated with status as a "controlled foreign corporation" under the applicable provisions of the U.S. Internal Revenue Code of 1986, as amended; risks associated with our investments and other risks and uncertainties described under the heading “Risk Factors” of this annual report.
3
Cautionary Note to U.S. Investors Concerning Disclosure of Mineral Resources
Unless otherwise indicated, all resource estimates included in this Form 10-K have been prepared in accordance with Canadian National Instrument 43-101 Standards of Disclosure for Mineral Projects (“NI 43-101”) and the Canadian Institute of Mining, Metallurgy and Petroleum Definition Standards for Mineral Resources and Mineral Reserves (“CIM Definition Standards”). NI 43-101 is a rule developed by the Canadian Securities Administrators which establishes standards for all public disclosure an issuer makes of scientific and technical information concerning mineral projects. NI 43-101 permits the disclosure of an historical estimate made prior to the adoption of NI 43-101 that does not comply with NI 43-101 to be disclosed using the historical terminology if the disclosure: (a) identifies the source and date of the historical estimate; (b) comments on the relevance and reliability of the historical estimate; (c) to the extent known, provides the key assumptions, parameters and methods used to prepare the historical estimate; (d) states whether the historical estimate uses categories other than those prescribed by NI 43-101; and (e) includes any more recent estimates or data available.
Canadian standards, including NI 43-101, differ significantly from the requirements of the United States Securities and Exchange Commission (“SEC”), and resource information contained in this Form 10-K may not be comparable to similar information disclosed by U.S. companies. In particular, the term “resource” does not equate to the term “‘reserves”. Under SEC Industry Guide 7, mineralization may not be classified as a “reserve” unless the determination has been made that the mineralization could be economically and legally produced or extracted at the time the reserve determination is made. SEC Industry Guide 7 does not define and the SEC’s disclosure standards normally do not permit the inclusion of information concerning “measured mineral resources”, “indicated mineral resources” or “inferred mineral resources” or other descriptions of the amount of mineralization in mineral deposits that do not constitute “reserves” by U.S. standards in documents filed with the SEC. U.S. investors should also understand that “inferred mineral resources” have a great amount of uncertainty as to their existence and great uncertainty as to their economic and legal feasibility. It cannot be assumed that all or any part of an “inferred mineral resource” will ever be upgraded to a higher category. Under Canadian rules, estimated “inferred mineral resources” may not form the basis of feasibility or pre-feasibility studies except in rare cases. Investors are cautioned not to assume that all or any part of an “inferred mineral resource” exists or is economically or legally mineable. Disclosure of “contained ounces” in a resource is permitted disclosure under Canadian regulations; however, the SEC normally only permits issuers to report mineralization that does not constitute “reserves” by SEC standards as in-place tonnage and grade without reference to unit measures. Accordingly, information concerning mineral deposits set forth herein may not be comparable to information made public by companies that report in accordance with United States standards.
NI 43-101 Review of Technical Information: John Cooper, Ur-Energy Project Geologist, P.Geo. and SME Registered Member, and Qualified Person as defined by National Instrument 43-101, reviewed and approved the technical information contained in this Annual Report.
4
Glossary of Common Terms and Abbreviations
|
Mineral Resource |
is a concentration or occurrence of diamonds, natural solid inorganic material, or natural solid fossilized organic material including base and precious metals, coal, and industrial minerals in or on the Earth’s crust in such form and quantity and of such a grade or quality that it has reasonable prospects for economic extraction. The location, quantity, grade, geological characteristics and continuity of a Mineral Resource are known, estimated or interpreted from specific geological evidence and knowledge. CIM Definition Standards; Canadian National Instrument 43-101 (“NI 43-101”), Section 1.1. |
|
|
|
|
Inferred Mineral Resource |
is that part of a Mineral Resource for which quantity and grade or quality can be estimated on the basis of geological evidence and limited sampling and reasonably assumed, but not verified, geological and grade continuity. The estimate is based on limited information and sampling gathered through appropriate techniques from locations such as outcrops, trenches, pits, workings and drill holes. CIM Definition Standards; NI 43-101, Section 1.1. |
|
|
|
|
Indicated Mineral Resource |
is that part of a Mineral Resource for which quantity, grade or quality, densities, shape and physical characteristics, can be estimated with a level of confidence sufficient to allow the appropriate application of technical and economic parameters, to support mine planning and evaluation of the economic viability of the deposit. The estimate is based on detailed and reliable exploration and testing information gathered through appropriate techniques from locations such as outcrops, trenches, pits, workings and drill holes that are spaced closely enough for geological and grade continuity to be reasonably assumed. CIM Definition Standards; NI 43-101, Section 1.1. |
|
|
|
|
Measured Mineral Resource |
is that part of a Mineral Resource for which quantity, grade or quality, densities, shape, and physical characteristics are so well established that they can be estimated with confidence sufficient to allow the appropriate application of technical and economic parameters, to support production planning and evaluation of the economic viability of the deposit. The estimate is based on detailed and reliable exploration, sampling and testing information gathered through appropriate techniques from locations such as outcrops, trenches, pits, workings and drill holes that are spaced closely enough to confirm both geological and grade continuity. CIM Definition Standards; NI 43-101, Section 1.1. |
|
|
|
|
Lithology |
is a description of a rock; generally its physical nature. The description would address such things as grain size, texture, rounding, and even chemical composition. A lithologic description would be: coarse grained well rounded quartz sandstone with 10% pink feldspar and 1% muscovite. |
|
|
|
|
PFN |
is a modern geologic logging method known as Prompt Fission Neutron. PFN is considered a direct measurement of true uranium concentration (% U) and is used to verify the grades of mineral intercepts previously reported by gamma logging. PFN logging is accomplished by a down-hole probe in much the same manner as gamma logs, however only the mineralized interval plus a buffer interval above and below are logged. |
5
Abbreviations:
|
BLM |
U.S. Bureau of Land Management |
|
CERCLA |
Comprehensive Environmental Response and Liability Act |
|
CIM |
Canadian Institute of Mining, Metallurgy and Petroleum |
|
DDW |
Deep Disposal Well |
|
eU3O8 |
equivalent U3O8 as measured by a calibrated gamma instrument |
|
EMT |
East Mineral Trend, located within our LC East Project (Great Divide Basin, Wyoming) |
|
EPA |
U.S. Environmental Protection Agency |
|
GDB |
Great Divide Basin, Wyoming |
|
GPM |
Gallons per minute |
|
GT |
Grade x Thickness product (% ft.) of a mineral intercept (expressed without units) |
|
IX |
Ion Exchange |
|
ISR |
In Situ Recovery (literally, ‘in place’ recovery) (also known as in situ leach or ISL) |
|
MMT |
Main Mineral Trend, located within our Lost Creek Project (Great Divide Basin, Wyoming) |
|
MU |
Mine Unit (also referred to as wellfield) |
|
NI 43-101 |
Canadian National Instrument 43-101 (Standards of Disclosure for Mineral Properties) |
|
NRC |
U.S. Nuclear Regulatory Commission |
|
PEA |
Preliminary Economic Assessment |
|
RCRA |
Resource Conservation and Recovery Act |
|
SEC |
U.S. Securities Exchange Commission |
|
Unat |
Uranium in its natural isotopic ratios |
|
UIC |
Underground Injection Control (pursuant to U.S. Environmental Protection Agency regulations) |
|
U3O8 |
A standard chemical formula commonly used to express the natural form of uranium mineralization. U represents uranium and O represents oxygen. |
|
USFWS |
U.S. Fish and Wildlife Service |
|
WDEQ |
Wyoming Department of Environmental Quality (and its various divisions, LQD/Land Quality Division, WQD/Water Quality Division; AQD/Air Quality Division; and Solid and Hazardous Waste Division) |
|
WEQC |
Wyoming Environmental Quality Council |
|
WGFD |
Wyoming Game and Fish Department |
Metric/Imperial Conversion Table
The imperial equivalents of the metric units of measurement used in this annual report are as follows:
|
Imperial Measure |
Metric Unit |
Metric Unit |
Imperial Measure |
|
0.03215 troy ounces |
1 gram |
31.1035 grams |
1 troy ounce |
|
2.4711 acres |
1 hectare |
0.4047 hectares |
1 acre |
|
2.2046 pounds |
1 kilogram |
0.4536 kilograms |
1 pound |
|
0.6214 miles |
1 kilometer |
1.6093 kilometers |
1 mile |
|
3.2808 feet |
1 meter |
0.3048 meters |
1 foot |
|
1.1023 short tons |
1 tonne |
0.9072 tonnes |
1 short ton |
6
Reporting Currency
All amounts in this report are expressed in United States dollars, unless otherwise indicated. Financial information is presented in accordance with United States generally accepted accounting principles.
Items 1 and 2. BUSINESS AND PROPERTIES
Overview and Corporate Structure
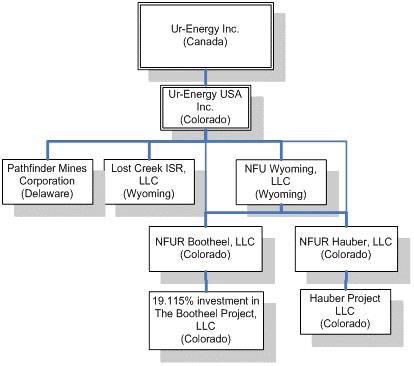
Incorporated on March 22, 2004, Ur-Energy is an exploration stage mining company, as that term is defined in Securities and Exchange Commission (“SEC”) Industry Guide 7. We are engaged in uranium mining, recovery and processing activities, including the acquisition, exploration, development and operation of uranium mineral properties in the United States. We began operation of our first in situ recovery uranium mine at our Lost Creek Project, Wyoming in 2013. Ur-Energy is a corporation continued under the Canada Business Corporations Act on August 8, 2006. Our Common Shares are listed on the TSX under the symbol “URE” and on the NYSE MKT under the symbol “URG.”
Ur-Energy has one wholly-owned subsidiary: Ur-Energy USA Inc. (“Ur-Energy USA”), a company incorporated under the laws of the State of Colorado.
Ur-Energy USA has three wholly-owned subsidiaries: NFU Wyoming, LLC (“NFU Wyoming”), a limited liability company formed under the laws of the State of Wyoming to facilitate acquisition of certain property and assets and, currently, to act as our land holding and exploration entity; Lost Creek ISR, LLC, a limited liability company formed under the laws of the State of Wyoming to hold and operate our Lost Creek Project and certain other of our Lost Creek properties and assets; and Pathfinder Mines Corporation (“Pathfinder”), a company incorporated under the laws of the State of Delaware, acquired in December 2013, which holds, among other assets, the Shirley Basin and Lucky Mc properties in Wyoming.
Ur-Energy USA has two jointly held subsidiaries with NFU Wyoming: NFUR Bootheel, LLC (“NFUR Bootheel”), a limited liability company formed under the laws of the State of Colorado to facilitate participation in an exploration, mining and development agreement with Jet Metal Corp. (formerly, Crosshair Energy Corporation); and NFUR Hauber, LLC (“NFUR Hauber”), a limited liability company formed under the laws of the State of Colorado to facilitate participation in a venture project at our Hauber project.
NFUR Hauber has one wholly-owned subsidiary: Hauber Project LLC, a limited liability company formed under the laws of the State of Colorado to hold our Hauber project. NFUR Hauber is the sole member and manager of Hauber Project LLC.
NFUR Bootheel has one subsidiary: The Bootheel Project, LLC, a limited liability company formed under the laws of the State of Colorado to hold the Bootheel property (and, formerly, the Buck Point property) is a venture with Jet Metal Corp., in which, at December 31, 2014, we own a 19.115% interest.
7
Currently, and at December 31, 2014, our principal direct and indirect subsidiaries, and affiliated entities, and the jurisdictions in which they were incorporated or organized, are as follows:
We are engaged in uranium mining, recovery and processing operations, in addition to the exploration and development of uranium mineral properties. Our wholly-owned Lost Creek Project in Sweetwater County, Wyoming is our flagship property. The project has been fully permitted and licensed since October 2012. We received operational approval from the U.S. Nuclear Regulatory Commission (“NRC”), and started production operation activities in August 2013. Our first sales of production from Lost Creek were made in December 2013; sales were made in all quarters of 2014.
Currently, we have nine mid- and long-term uranium sales agreements in place with U.S. utilities for the sale of Lost Creek production at contracted pricing. Combined, these multi-year sales agreements represent a significant portion of our anticipated production into 2020. These agreements, individually, do not represent a substantial portion of our annual projected production, and our business is therefore not substantially dependent upon any one of the agreements.
Our newest project, Shirley Basin, is one of the assets we acquired as a part of the Pathfinder transaction which closed in December 2013. We also acquired all the historic geologic and engineering data for the project, which has nearly 5,500 historic drillholes and historic reports indicating a remaining historic resource. During 2014, we completed a drill program of a limited number of confirmatory holes to complete an NI 43-101 mineral resource estimate which was released in August 2014; subsequently, an NI 43-101 Preliminary Economic Assessment for Shirley Basin was issued in January 2015. Baseline studies necessary for the permitting and licensing of the project also commenced in 2014 and are anticipated to be complete in the first half 2015.
We utilize in situ recovery of the uranium at Lost Creek and will do so at other projects where this is possible. The in situ recovery (ISR) technique is employed in uranium extraction because it allows for a lower cost and effective recovery of roll front mineralization. The in situ technique does not require the installation of tailings
8
facilities or significant surface disturbance. This mining method utilizes injection wells to introduce a mining solution, called lixiviant, into the mineralized zone. The lixiviant is made of natural groundwater fortified with oxygen as an oxidizer, sodium bicarbonate as a complexing agent, and carbon dioxide for pH control. The complexing agent bonds with the uranium to form uranyl carbonate which is highly soluble. The dissolved uranyl carbonate is then recovered through a series of production wells and piped to a processing plant where the uranyl carbonate is removed from the solution using Ion Exchange (IX). The groundwater is re-fortified with the oxidizer and complexing agent and sent back to the wellfield to recover additional uranium.
Our Lost Creek processing facility includes all circuits for the production, drying and packaging of uranium yellowcake for delivery into sales. As contemplated in the Preliminary Economic Assessment of Shirley Basin, we expect that the Lost Creek processing facility will be utilized for the drying and packaging of uranium from Shirley Basin, for which we currently anticipate the need only for a satellite plant.
9
Our Mineral Properties
Our current land portfolio includes 14 projects in the United States. Ten of the U.S. projects are in the Great Divide Basin, Wyoming, including our flagship project, Lost Creek Project, which began production operations in August 2013. Currently we control a total of more than 2,100 unpatented mining claims and four State of Wyoming mineral leases for a total of more than 42,000 acres (16,997 hectares) in the area of the Lost Creek Property, including the Lost Creek permit area (the “Lost Creek Project” or “Project”) and certain adjoining properties which we refer to as LC East, LC West, LC North, LC South and EN project areas (collectively, with the Lost Creek Project, the “Lost Creek Property”). Five of the projects at the Lost Creek Property contain NI 43-101 compliant mineral resources: Lost Creek, LC East, LC West, LC South and LC North. See Resource Summary below in Technical Developments. Below is a map showing our Wyoming projects and the geologic basins in which they are located.
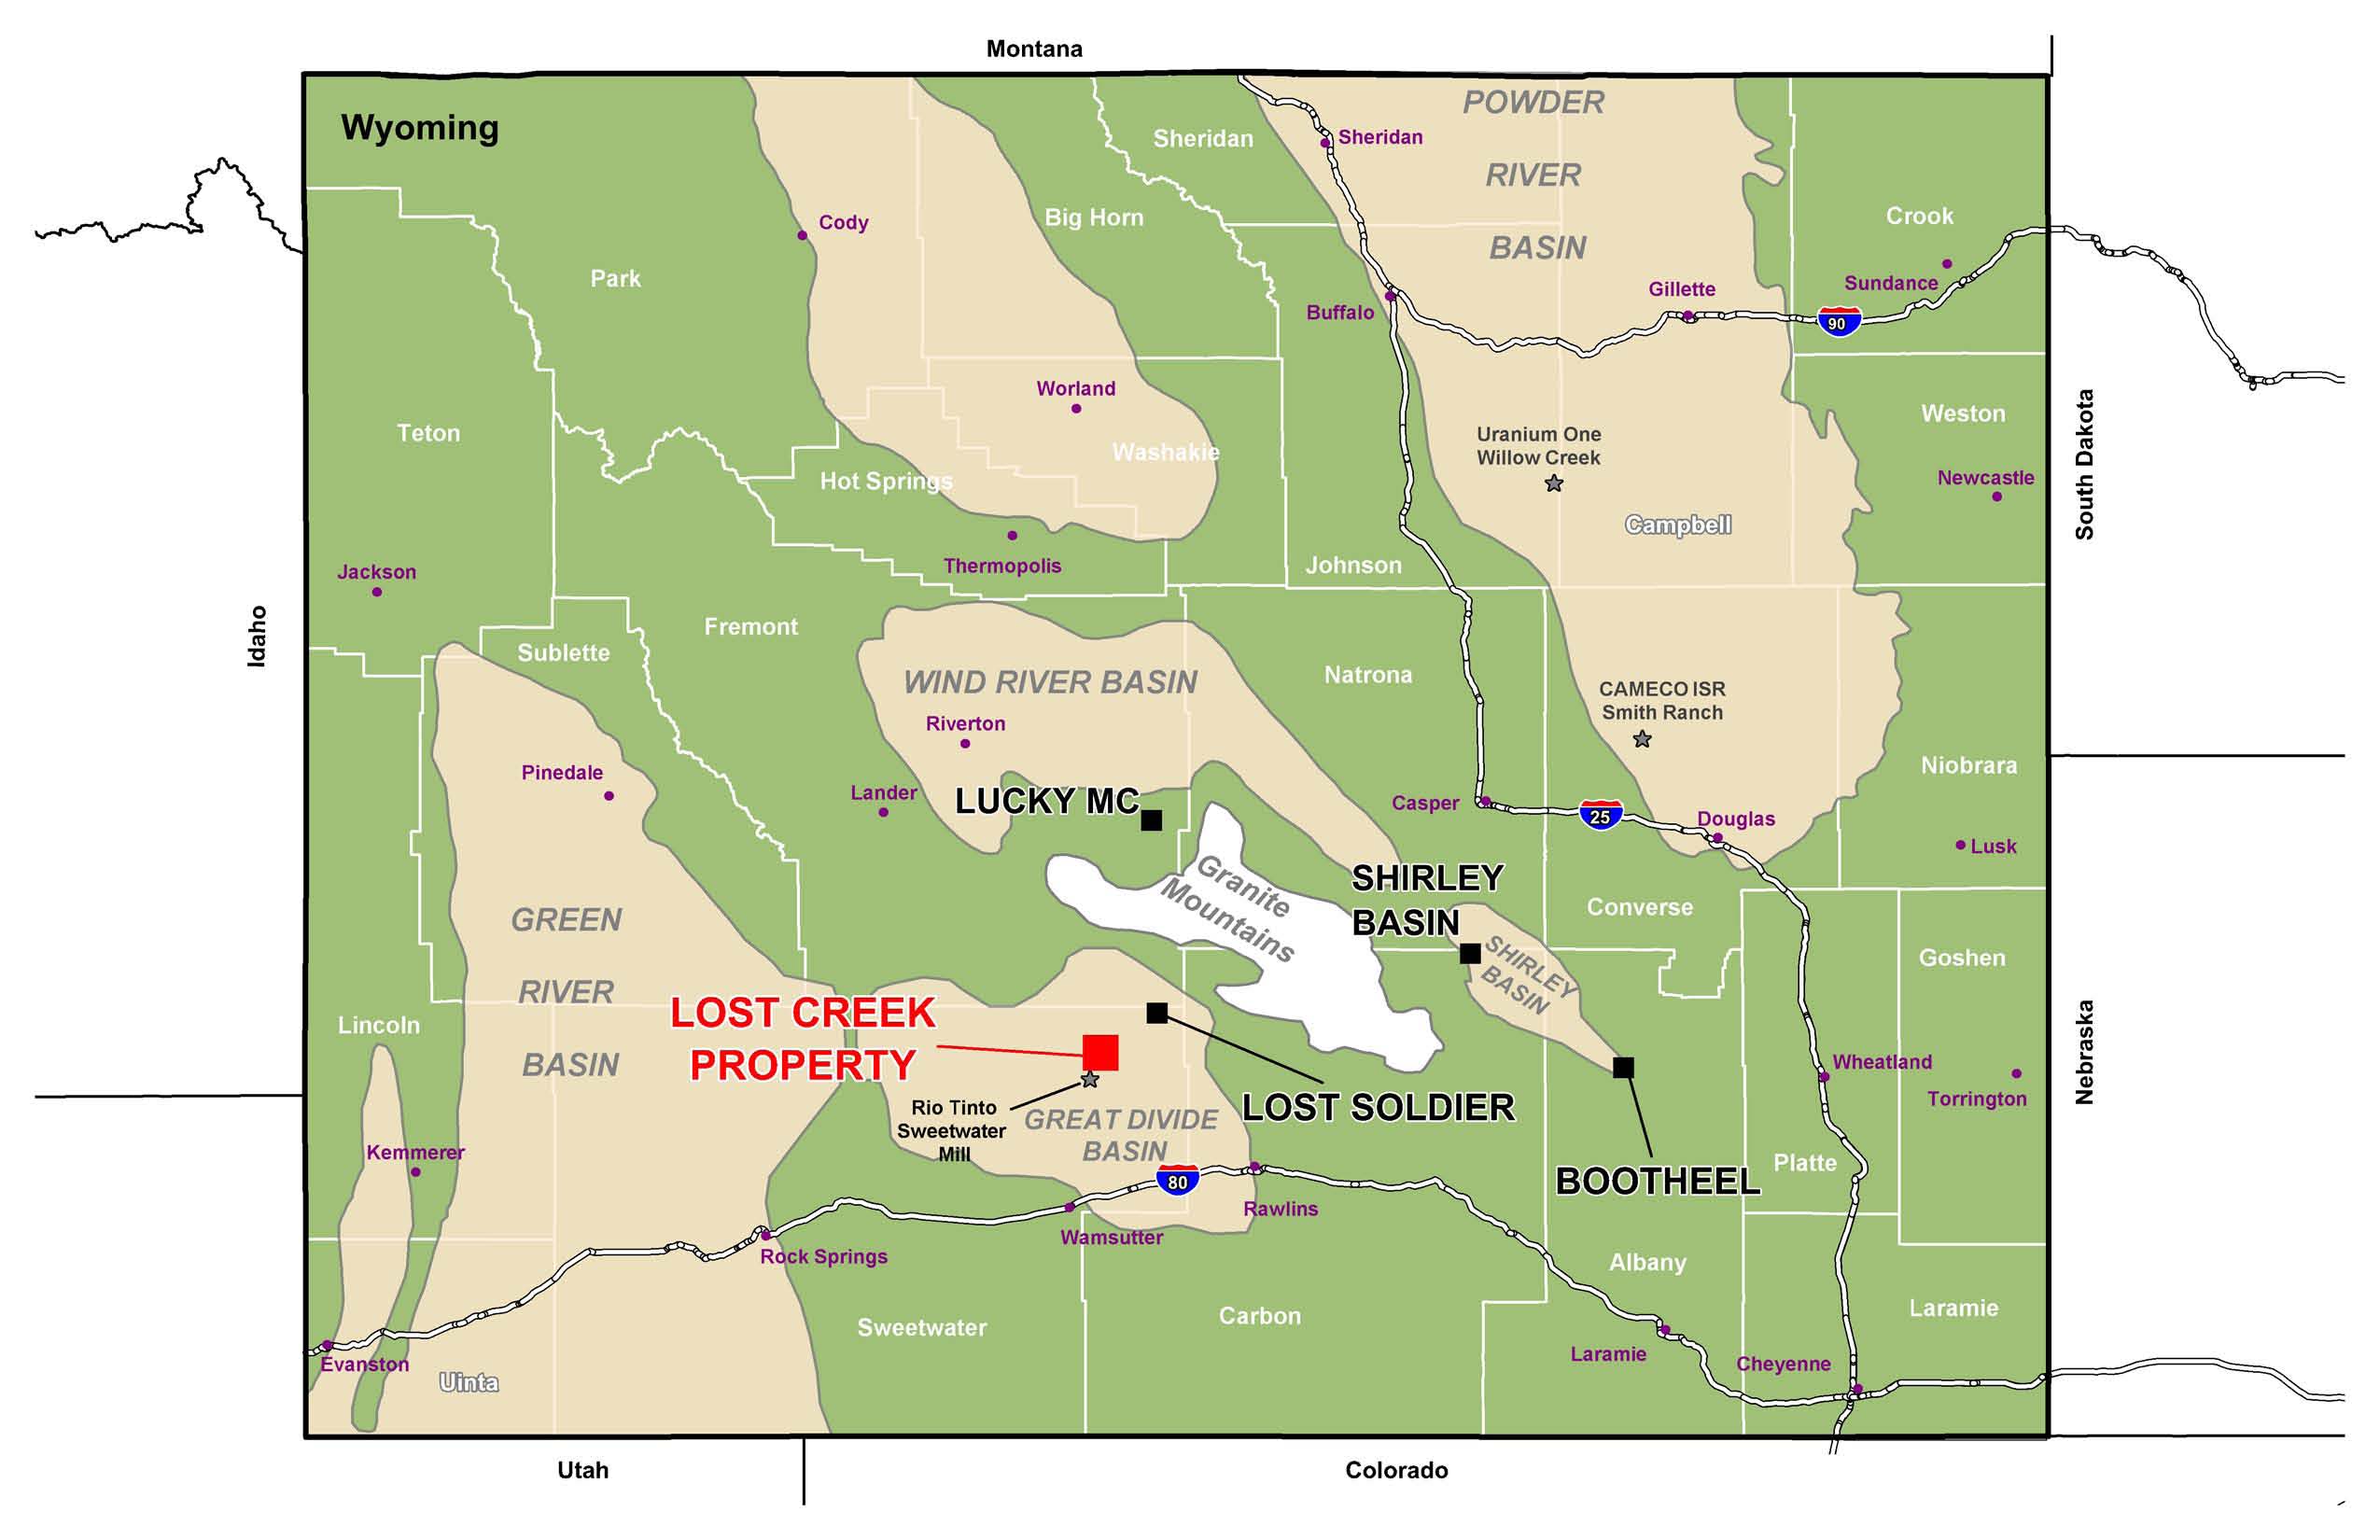
Our Wyoming properties together total more than 66,000 acres (approximately 27,000 hectares) and include two properties, Shirley Basin and Lucky Mc, obtained through our acquisition of Pathfinder Mines Corporation in December 2013.
10
Operating Properties
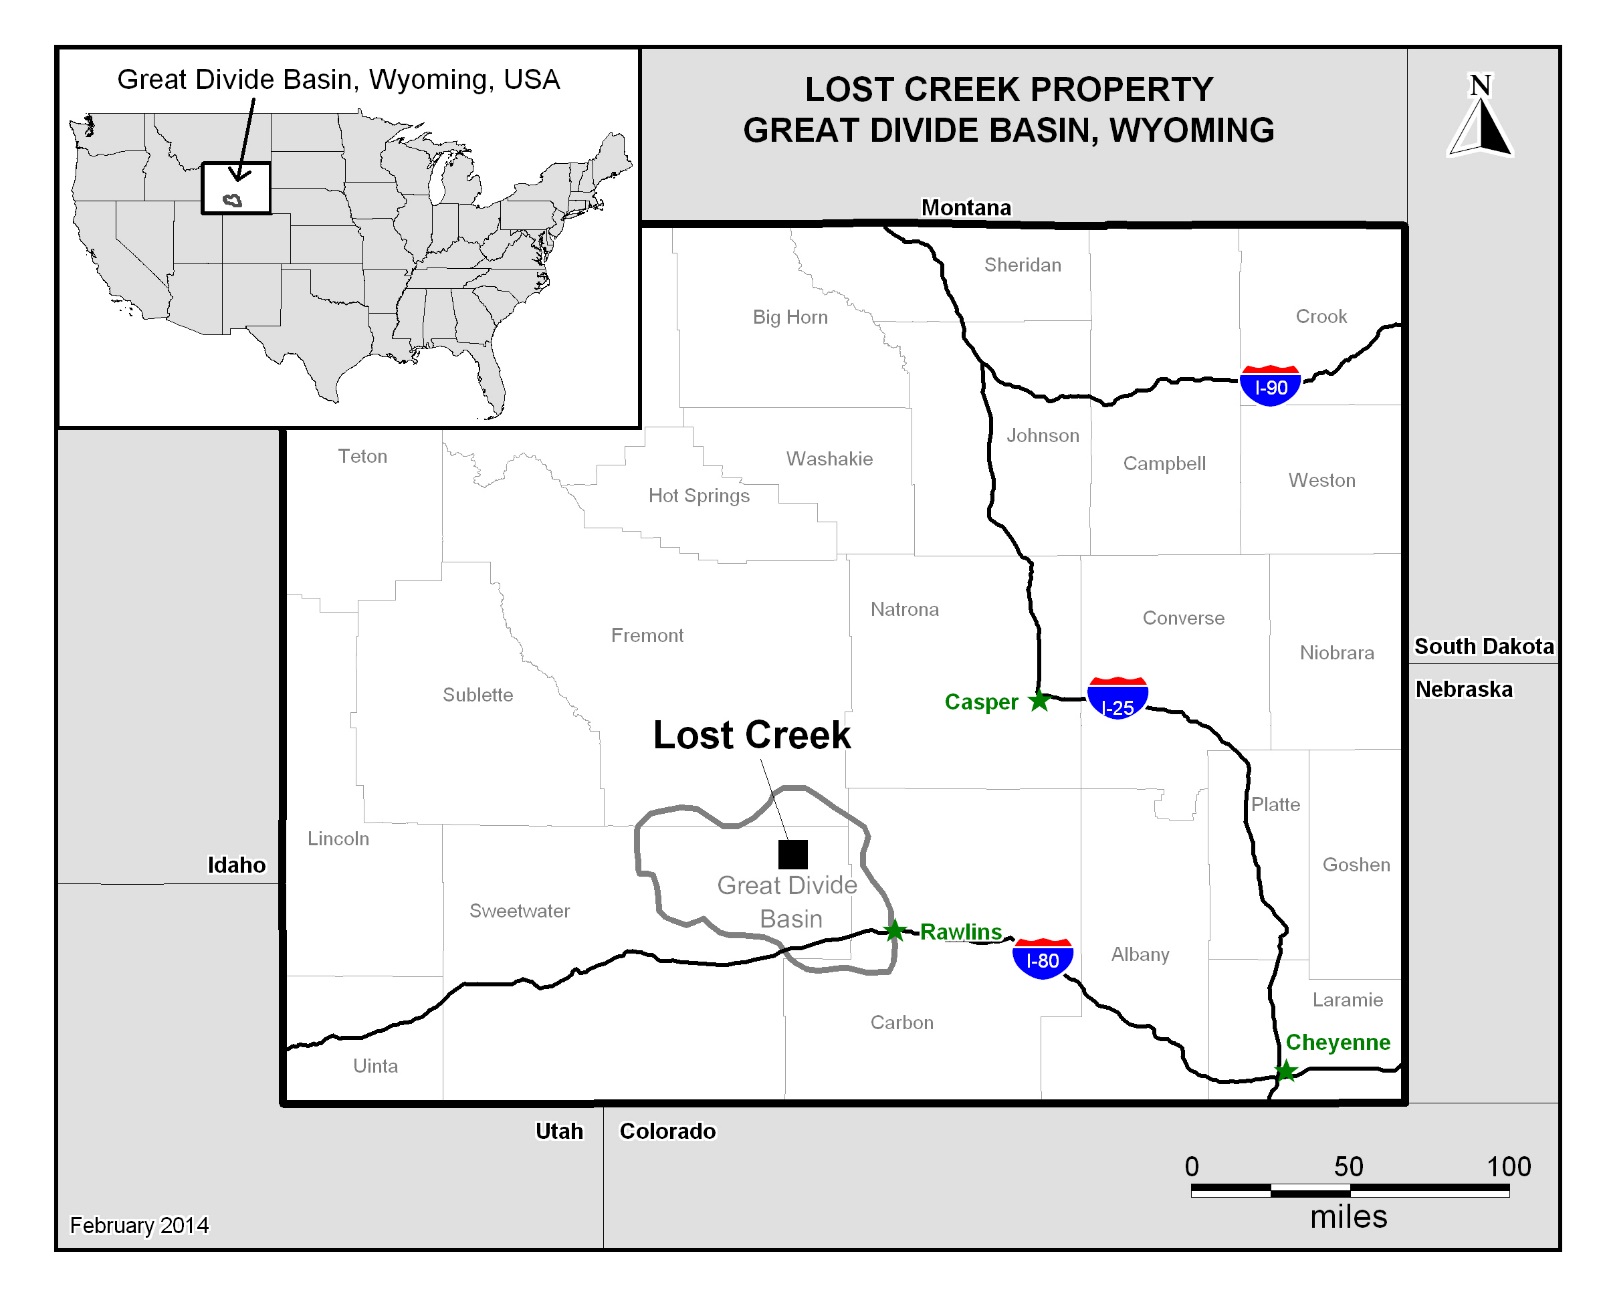
Lost Creek Project – Great Divide Basin, Wyoming
The Lost Creek Project area was acquired in 2005, and is located in the Great Divide Basin, Wyoming. The Main Mineral Trend of the Lost Creek uranium deposit (the “MMT”) is located within the Lost Creek Project. The permit area of the Lost Creek Project covers 4,254 acres (1,722 hectares), comprising 201 lode mining claims and one State of Wyoming mineral lease section. Regional access relies almost exclusively on existing public roads and highways. The local and regional transportation network consists of primary, secondary, local and unimproved roads. Direct access to Lost Creek is mainly on two crown-and-ditched gravel paved access roads to the processing plant. One road enters from the west off of Sweetwater County Road 23N (Wamsutter-Crooks Gap Road); the other enters from the east off of BLM Sooner Road. On a wider basis, from population centers, the Property area is served by an Interstate Highway (Interstate 80), a US Highway (US 287), Wyoming state routes (SR 220 and 73 to Bairoil), local county roads, and BLM roads. The Lost Creek Property is located as shown here:
11
The basic infrastructure (power, water, and transportation) necessary to support our ISR operation is located within reasonable proximity. Generally, the proximity of Lost Creek to paved roads is beneficial with respect to transportation of equipment, supplies, personnel and product to and from the property. Existing regional overhead electrical service is aligned in a north-to-south direction along the western boundary of the Lost Creek Project. A new overhead power line, approximately two miles in length, was constructed to bring power from the existing Pacific Power line to the Lost Creek plant. Power drops have been made to the property and distributed to the plant, offices, wellfields, and other facilities.
Following the repurchase of an existing production royalty with respect to 20 claims of the Lost Creek Project in April 2013, there are no remaining royalties at the Lost Creek Project, except for the royalty on the State of Wyoming section mineral lease as provided by law. Currently, there is no significant production planned from the State lease section.
Production Operations
Following receipt of the final regulatory authorization in October 2012, we commenced construction at Lost Creek. Construction included the plant facility and office building, installation of all process equipment, installation of two access roads, additional power lines and drop lines, deep disposal wells, construction of two holding ponds, warehouse building, and drillshed building. In August 2013 we were given operational approval by the NRC and commenced production operation activities. Since that time we have worked to commission all aspects of the plant facility and wellfield operations. Extensive wellfield construction of Mine Unit 1, was completed prior to commencement of operations, and continued through 2014. Construction and installation of seven operating header houses was completed before year-end 2014, and further construction allowed two additional header houses to be brought online during Q1 2015.
Updated Preliminary Economic Assessment for Lost Creek Property
During 2013, we issued an updated Preliminary Economic Assessment for the Lost Creek Property Sweetwater County Wyoming (December 30, 2013 (TREC, Inc.))(the “Lost Creek PEA”). According to the Lost Creek PEA, the current mineral resources at the Lost Creek Property are as follows:
12
Lost Creek Property - Resource Summary
|
MEASURED |
INDICATED |
INFERRED |
|||||||||
|
PROJECT |
AVG GRADE |
SHORT TONS |
POUNDS |
AVG GRADE |
SHORT TONS |
POUNDS |
AVG GRADE |
SHORT TONS |
POUNDS |
||
|
% eU3O8 |
(X 1000) |
(X 1000) |
% eU3O8 |
(X 1000) |
(X 1000) |
% eU3O8 |
(X 1000) |
(X 1000) |
|||
|
LOST CREEK |
0.058 | 3,117 | 3,590 | 0.052 | 2,350 | 2,444 | 0.057 | 1,836 | 2,085 | ||
|
LC EAST |
0.054 | 1,175 | 1,260 | 0.040 | 1,690 | 1,361 | 0.046 | 1,666 | 1,533 | ||
|
LC NORTH |
----- |
----- |
----- |
----- |
----- |
----- |
0.049 | 489 | 482 | ||
|
LC SOUTH |
----- |
----- |
----- |
----- |
----- |
----- |
0.042 | 710 | 603 | ||
|
LC WEST |
----- |
----- |
----- |
----- |
----- |
----- |
0.109 | 17 | 37 | ||
|
EN |
----- |
----- |
----- |
----- |
----- |
----- |
----- |
----- |
----- |
||
|
GRAND TOTAL |
0.057 | 4,292 | 4,850 | 0.048 | 4,039 | 3,805 | 0.051 | 4,718 | 4,740 | ||
|
MEASURED + INDICATED = |
8,332 | 8,655 | |||||||||
Notes:
|
1. |
Sum of Measured and Indicated tons and pounds may not add to the reported total due to rounding. |
|
2. |
Mineral resources that are not mineral reserves do not have demonstrated economic viability. |
|
3. |
Based on grade cutoff of 0.02 percent eU3O8 and a grade x thickness cutoff of 0.3 GT. |
|
4. |
Typical ISR industry practice is to apply a GT cutoff in the range of 0.3 which has generally been determined to be a viable cut-off value. This 0.3 GT cutoff was used in this evaluation without direct relation to an associated price. |
|
5. |
Measured, Indicated, and Inferred Mineral Resources as defined in Section 1.2 of NI 43-101 (CIM Definition Standards). |
|
6. |
Resources are reported through August 31, 2013. |
Information shown in the table above differs from the disclosure requirements of the SEC. See Cautionary Note to U.S. Investors Concerning Disclosure of Mineral Resources, above.
The Lost Creek PEA mineral resource estimate includes drill data and analyses of more than three thousand holes and nearly 1.8 million feet of drilling at the Lost Creek Project alone. With the acquisition of Lost Creek project, we acquired logs and analyses from 571 historic holes representing 368,000 feet of data. Drilling at Lost Creek through August 31, 2013 was included in the PEA. Additionally, drilling from the other five projects at the Lost Creek Property, both historic and our drill programs, is included in the mineral resource estimate. Collectively, this represents an additional 2,377 drillholes (1,301,329 feet). Since our acquisition of the project we have drilled 2,551 holes and wells including the construction and development drilling during 2012-2014 for Mine Unit 1 at Lost Creek.
Regulatory Authorizations and Land Title of Lost Creek
Beginning in 2007, we completed all necessary applications and related processes to obtain the required permitting and licenses for the Lost Creek Project, of which the three most significant are: a Source and Byproduct Materials License from the U.S. Nuclear Regulatory Commission (“NRC”) (received August 2011);
13
a Plan of Operations with the United States Bureau of Land Management (“BLM”) (Record of Decision (“ROD”) received October 2012; affirmed by U.S. District Court for the District of Wyoming, September 2013); and a Permit and License to Mine from the Wyoming Department of Environmental Quality (“WDEQ”) (October 2011). The WDEQ License to Mine was issued following determinations in favor of the project by the Wyoming Environmental Quality Council (“WEQC”) with respect to a third-party objection, which included a WEQC direction that the WDEQ Permit be approved by the WDEQ. The WDEQ Permit includes the approval of the first mine unit, as well as the Wildlife Management Plan, including a positive determination of the protective measures at the project for the greater sage-grouse species.
In March 2010, the U.S. Fish and Wildlife Service (“USFWS”) submitted a finding of “warranted for listing but precluded by higher priorities” with regard to the greater sage-grouse, whose habitat includes Wyoming. A finding that listing is “warranted but precluded” results in recognition of the greater sage-grouse as a candidate for listing. This finding is reconsidered annually, taking into account changes in the status of the species. When higher priority listing actions have been addressed by the USFWS for other species, a proposed listing rule is prepared and issued for public comment. This means that until the USFWS finalizes a listing determination, the greater sage-grouse will remain under state management. Pursuant to a settlement agreement, issued as a consent decree of a federal district court, the USFWS is scheduled to make a listing decision on or before September 30, 2015. Based upon a federal statutory mandate that no funds be expended on the project during FY 2015, the timing for a listing decision is likely delayed. There is also litigation pending challenging the propriety of such a listing decision, based upon the content of the settlement agreement.
Meanwhile, in related regulatory processes, the BLM has prepared and published for public comment amendments to eleven Resource Management Plans (“RMPs”), related to the greater sage-grouse. Included in these RMPs are proposals to designate millions of acres of federal lands currently open for mineral location as lands to be withdrawn from such mineral status. The final environmental impact statements and records of decisions on most of the RMPs have not been issued, but are expected during 2015. The outcomes and records of decision are anticipated to be litigated and therefore may be several years into the future before resolution. As well, any permanent withdrawal of lands from mineral location would require Congressional action.
As a part of the Lost Creek WDEQ Application, we submitted a Wildlife Protection Plan addressing, among other issues, the sage-grouse. The Wyoming Game and Fish Department (“WGFD”) reviewed and recommended the Wildlife Management Plan to the WDEQ, including findings that the Wildlife Management Plan meets all of the protection measures for the greater sage-grouse species, and is consistent with the Wyoming Governor’s Executive Order on the sage-grouse. Following WGFD’s recommendation, the Lost Creek Wildlife Management Plan was incorporated into the WDEQ Permit, and subsequently upheld by the WEQC rulings.
The State of Wyoming has developed a “core-area strategy” to help protect the greater sage-grouse species within certain core areas of the state. Exploration areas of our Lost Creek property are all within a designated core area and are thus subject to work activity restrictions from March 1 to July 15 of each year. The timing restriction precludes exploration drilling and other non-operational based activities which may disturb the sage-grouse. Drilling activity is not restricted outside this period. The sage-grouse timing restrictions relevant to ISR production and operational activities at the Lost Creek Project are somewhat different because the State has recognized that mining projects within core areas must be allowed to operate year-round. Therefore, there are no timing restrictions on drilling, construction, or operational activities within pre-approved disturbed areas within our permit to mine.
Additional authorizations from federal, state and local agencies for the Lost Creek project include: WDEQ-Air Quality Division Air Quality Permit and WDEQ-Water Quality Division Class I Underground Injection Control
14
(“UIC”) Permit. The latter permit allows Lost Creek to operate up to five Class I injection wells to meet the anticipated disposal requirements for the life of the Lost Creek Project. The Environmental Protection Agency (“EPA”) issued an aquifer exemption for the Lost Creek project. The WDEQ’s separate approval of the aquifer reclassification is a part of the WDEQ Permit. We also received approval from the EPA and the Wyoming State Engineer’s Office for the construction and operation of two holding ponds at Lost Creek.
Through certain of our subsidiaries, we control the federal unpatented lode mining claims and State of Wyoming mineral leases which make up the Lost Creek Property. Title to the mining claims is subject to rights of pedis possessio against all third-party claimants as long as the claims are maintained. The mining claims do not have an expiration date. Affidavits have been timely filed with the BLM and recorded with the Sweetwater County Recorder attesting to the payment of annual maintenance fees to the BLM as established by law from time to time. The state leases have a ten-year term, subject to renewal for successive ten-year terms.
The surface of all the mining claims is controlled by the BLM, while we have the right to use as much of the surface as is necessary for exploration and mining of the claims, subject to compliance with all federal, state and local laws and regulations. Surface use on BLM lands is administered under federal regulations. Similarly, access to state-controlled land is largely inherent within the State of Wyoming mineral lease. The state lease at the Lost Creek Project requires a nominal surface impact fee to be paid. The other state mineral leases currently do not have surface impact payment obligations.
Exploration and Development Properties
Our Five Projects Adjoining Lost Creek Together with the Lost Creek Project Form the Lost Creek Property
The LC East and LC West Projects (currently, approximately 5,260 acres (2,129 hectares) and 3,840 acres (1,554 hectares), respectively) were added to the Lost Creek Property in 2012. The two projects were formed through location of new unpatented lode mining claims and the asset exchange completed in February 2012 with Uranium One Americas, Inc., through which we acquired 175 unpatented mining claims and related data. In 2012, all baseline studies at LC East were initiated. In 2014, we submitted applications for amendments of the Lost Creek licenses and permits to include development of LC East. We also located additional lode mining claims to secure the lands in what will be the LC East permit area. The East Mineral Trend (the “EMT”) is a second mineral trend of significance, in addition to the MMT at Lost Creek, identified by historic drilling on the lands forming LC East. Although geologically similar, it appears to be a separate and independent trend from the MMT. The Lost Creek PEA recommends delineation drilling of identified resources in the EMT continue, together with baseline studies toward a goal of permitting future production. As well, exploration drilling in the northern portions of the project is recommended. We also intend to conduct exploration drilling of LC West to pursue extensions of the MMT in the HJ and KM horizons of the deposit.
The LC North Project (approximately 7,489 acres (3,031 hectares)) is located to the north and to the west of the Lost Creek Project. Historical wide-spaced exploration drilling on this project consisted of 161 drill holes. In 2007, Ur‑Energy drilled 30 exploration holes in two areas immediately north of the Lost Creek Project. In 2011, additional drilling was conducted on the LC North Project; in total, 105 holes and one well were drilled (total, 101,919 feet 31,065 meters)). Exploration drilling will be conducted at LC North to pursue the potential of an extension of the MMT in the HJ and KM horizons.
The LC South Project (approximately 11,467 acres (4,641 hectares)) is located to the south and southeast of the Lost Creek Project. Historical drilling on the LC South Project consisted of 482 drill holes. In 2010, Ur-Energy drilled 159 exploration holes (total, 101,270 feet (30,876 meters)) which confirmed numerous individual roll
15
front systems occurring within several stratigraphic horizons correlative to mineralized horizons in the Lost Creek Project. Also, a series of wide-spaced drill holes were part of this exploration program which identified deep oxidation (alteration) that represents the potential for several additional roll front horizons. The FG trend, the HJ and KM horizons will be further explored, as well as additional drilling to further evaluate the potential of deeper mineralization.
The EN Project (approximately 10,122 acres (4,096 hectares)) is adjacent to and east of LC South. Ur-Energy has over 50 historical drill logs from the EN project. Some minimal, deep, exploration drilling has been conducted at the project. Although no mineral resource is yet reported due to the limited nature of the data, the Lost Creek PEA continues to recommend that the EN project should be explored further with wide spaced framework drilling to assess regional alteration and stratigraphic relationships.
History and Geology of the Lost Creek Property
Uranium was discovered in the Great Divide Basin, where Lost Creek is located, in 1936. Exploration activity increased in the early 1950s after the Gas Hills District discoveries, and continued to increase in the 1960s, with the discovery of numerous additional occurrences of uranium. Wolf Land and Exploration (which later became Inexco), Climax (Amax) and Conoco Minerals were the earliest operators in the Lost Creek area and made the initial discoveries of low-grade uranium mineralization in 1968. Kerr-McGee, Humble Oil, and Valley Development, Inc. were also active in the area. Drilling within the current Lost Creek Project area from 1966 to 1976 consisted of approximately 115 wide-spaced exploration holes by several companies including Conoco, Climax (Amax), and Inexco.
Texasgulf acquired the western half of what is now the Lost Creek Project in 1976 through a joint venture with Climax and identified what is now referred to as the Main Mineral Trend (MMT). In 1978, Texasgulf optioned into a 50% interest in the adjoining Conoco ground to the east and continued drilling, fully identifying the MMT eastward to the current Project boundary; Texasgulf drilled approximately 412 exploration holes within what is now the Lost Creek Project. During this period Minerals Exploration Company (a subsidiary of Union Oil Company of California) drilled approximately 8 exploration holes in what is currently the western portion of the Lost Creek Project. Texasgulf dropped the project in 1983 due to declining market conditions. The ground was subsequently picked up by Cherokee Exploration, Inc. which conducted no field activities.
In 1987, Power Nuclear Corporation (also known as PNC Exploration) acquired 100% interest in the project from Cherokee Exploration, Inc. PNC Exploration conducted a limited exploration program and geologic investigation, as well as an evaluation of previous in situ leach testing by Texasgulf. PNC Exploration drilled a total of 36 holes within the current Project area.
In 2000, New Frontiers Uranium, LLC acquired the property and database from PNC Exploration, but conducted no drilling or geologic studies. New Frontiers Uranium, LLC later transferred the Lost Creek Project-area property along with its other Wyoming properties to its successor NFU Wyoming, LLC. In June 2005, Ur-Energy USA purchased 100% ownership of NFU Wyoming, LLC.
The Lost Creek Property is situated in the northeastern part of the GDB which is underlain by up to 25,000 ft. of Paleozoic to Quaternary sediments. The GDB lies within a unique divergence of the Continental Divide and is bounded by structural uplifts or fault displaced Precambrian rocks, resulting in internal drainage and an independent hydrogeologic system. The surficial geology in the GDB is dominated by the Battle Spring Formation of Eocene age. The dominant lithology in the Battle Spring Formation is coarse arkosic sandstone, interbedded with intermittent mudstone, claystone and siltstone. Deposition occurred as alluvial-fluvial fan deposits within a south-southwest flowing paleodrainage. The sedimentary source is considered to be the
16
Granite Mountains, approximately 30 miles to the north. Maximum thickness of the Battle Spring Formation sediments within the GDB is 6,000 ft.
Uranium deposits in the GDB are found principally in the Battle Spring Formation, which hosts the Lost Creek Project deposit. Lithology within the Lost Creek deposit consists of approximately 60% to 80% poorly consolidated, medium to coarse arkosic sands up to 50 ft. thick, and 20% to 40% interbedded mudstone, siltstone, claystone and fine sandstone, each generally less than 25 ft. thick. This lithological assemblage remains consistent throughout the entire vertical section of interest in the Battle Spring Formation.
Outcrop at Lost Creek is exclusively that of the Battle Spring Formation. Due to the soft nature of the formation, the Battle Spring Formation occurs largely as sub-crop beneath the soil. The alluvial fan origin of the formation yields a complex stratigraphic regime which has been subdivided throughout Lost Creek into several thick horizons dominated by sands, with intervening named mudstones. Lost Creek is currently licensed and permitted to produce from the HJ horizon; we are currently seeking amendment of the licenses to be able to produce from the KM horizon.
Pathfinder Mines Corporation: Shirley Basin Mine Site (Shirley Basin, Wyoming) and Lucky Mc Mine Site (Gas Hills Mine District, Wyoming)
As a part of the Pathfinder acquisition, we now own the Shirley Basin and Lucky Mc mine sites in the Shirley Basin and Gas Hills mining districts of Wyoming, respectively, from which Pathfinder and its predecessors historically produced more than seventy-one million pounds of uranium, primarily from the 1960s through the 1990s. Pathfinder’s predecessors included COGEMA, Lucky Mc Uranium Corporation, and Utah Construction/Utah International.
Both Lucky Mc and Shirley Basin conventional mine operations were suspended in the 1990s due to low uranium pricing, and facility reclamation was substantially completed. We assumed the remaining reclamation responsibilities including financial surety for reclamation, at Shirley Basin and at the Lucky Mc mine site. The Lucky Mc tailings site was fully reclaimed and, at the time of our acquisition, was in the process of being transferred to the U.S. Department of Energy. Therefore, we assumed no obligations with respect to the Lucky Mc tailings site, which were retained by the seller upon closing, or the NRC license at the site. We do not have plans for the further exploration or development of the Lucky Mc property during 2015.
Together with property holdings of patented lands, unpatented mining claims, and State of Wyoming and private leases totalling more than 5,500 acres (nearly 3,700 acres at Shirley Basin (approximately 1,500 hectares); approximately 1,800 at Lucky Mc (approximately 750 hectares)), we also acquired all historic geologic, engineering and operational data related to the two mine areas. Our project at Shirley Basin (the “Shirley Basin Project”) is located in Carbon County, Wyoming, approximately 40 miles south of Casper, Wyoming. The project is accessed by travelling west from Casper, on Highway 220. After travelling 18 miles, turn south on Highway 487 and travel an additional 35 miles; the entrance to Shirley Basin Mine is to the east.
Under the terms of our acquisition of Pathfinder, we are obligated to pay a 5% production royalty on production at the Shirley Basin Project under certain market conditions. That royalty will be limited by the following market conditions: (i) if the reported spot price exceeds $55 prior to June 30, 2016 the 5% gross royalty is capped at $6,625,000; (ii) if the reported spot price exceeds $45, but does not exceed $55 prior to June 30, 2016 the royalty cap is reduced to $3,700,000; (iii) if the reported spot price does not exceed $45 prior to June 30, 2016 the royalty is terminated. The amount of production royalty, if triggered, may be purchased back at any time at our election.
17
The tailings facility at the Shirley Basin site is one of the few remaining facilities in the United States that is licensed by the NRC to receive and dispose of byproduct waste material from other in situ uranium mines. We assumed the operation of the byproduct disposal site and accepted deliveries throughout 2014 under several existing contracts.
Preliminary Economic Assessment for Shirley Basin Uranium Project
In August 2014, we issued a Technical Report on Resources for the Shirley Basin Uranium Project Carbon County Wyoming (August 27, 2014). Subsequently, in January 2015, we issued a Preliminary Economic Assessment for the Shirley Basin Uranium Project Carbon County Wyoming, January 27, 2015 (the “Shirley Basin PEA”). The current mineral resources at the Shirley Basin Project are estimated as follows:
Shirley Basin Uranium Project - Resource Summary
|
MEASURED |
INDICATED |
|||||
|
RESOURCE |
AVG GRADE |
SHORT TONS |
POUNDS |
AVG GRADE |
SHORT TONS |
POUNDS |
|
AREA |
% eU3O8 |
(X 1000) |
(X 1000) |
(X 1000) |
(X 1000) |
(X 1000) |
|
FAB |
0.280 | 1,172 |
6,574 |
0.119 | 456 | 1,081 |
|
AREA 5 |
0.243 | 195 |
947 |
0.115 | 93 | 214 |
|
TOTAL |
0.275 | 1,367 |
7,521 |
0.118 | 549 | 1,295 |
|
MEASURED & INDICATED |
0.230 | 1,915 | 8,816 | |||
Notes:
|
1. |
Sum of Measured and Indicated tons and pounds may not add to the reported total due to rounding. |
|
2. |
Mineral resources that are not mineral reserves do not have demonstrated economic viability. |
|
3. |
Based on grade cutoff of 0.020 percent eU3O8 and a grade x thickness cutoff of 0.25 GT. |
|
4. |
Measured, Indicated, and Inferred Mineral Resources as defined in Section 1.2 of NI 43-101 (the CIM Definition Standards (CIM Council, 2014)). |
|
5. |
Resources are reported through July 2014. |
|
6. |
All reported resources occur below the historical, pre-mining static water table. |
|
7. |
Sandstone density is 16.0 cu. ft./ton. |
Information shown in the table above differs from the disclosure requirements of the SEC. See Cautionary Note to U.S. Investors Concerning Disclosure of Mineral Resources, above.
The Shirley Basin mineral resource estimate includes drill data and analyses of more than three thousand holes and nearly 1.2 million feet of historic drilling at the Shirley Basin Project which were acquired with the acquisition of Pathfinder. We drilled 14 confirmation holes representing approximately 6,600 feet which were included in the mineral resource estimate.
18
Shirley Basin History and Geology
The Shirley Basin property lies in the northern half of the historic Shirley Basin uranium mining district (the “District”), which is the second most prolific uranium mining district in Wyoming. Earliest discoveries were made in 1954 by Teton Exploration. This was followed by an extensive claim staking and drilling rush by several companies in 1957. Several important discoveries were made and the first mining was started in 1959 by Utah Construction Corp. (predecessor to Pathfinder). Underground mining methods were initially employed but encountered severe groundwater removal problems, so in 1961 Utah Construction switched to solution mining methods. This was the first commercially successful application of in situ solution mining recovery (ISR) for uranium in the United States. In 1968 market and production needs caused Utah Construction to move to open-pit mining and a conventional mill. All production within the district since that time has been by open-pit methods.
Several companies operated uranium mines within the District, however three companies were dominant. Utah Construction/Pathfinder’s efforts were focused in the northern portions of the District, while Getty was largely in the central portions, and Kerr-McGee was in the southern portions. In 1960 Getty and Kerr-McGee joined together as Petrotomics Company to build a mill for joint processing of their production. The last mining in the District ended in 1992 when Pathfinder shut down production due to market conditions. Total production from Shirley Basin was 51.3 million pounds of uranium, of which 28.3 million pounds came from the Utah Construction/Pathfinder operations which we now own.
Resources which we are currently targeting for ISR production represent unmined extensions of mineral trends addressed in past open-pit mines. These extensions had been targeted for mining but were abandoned with shut-down of the mining operations in 1992.
The Shirley Basin mining district lies in the north-central portions of the Shirley Basin geologic province, which is one of several inter-montane basins in Wyoming created 35-70 million years ago (mya) during the Laramide mountain building event. The Basin is floored by folded sedimentary formations of Cretaceous age (35-145 mya). These units were tilted by Laramide tectonic forces and subsequently exposed to erosion, creating a “paleo-topographic” surface. In the northern half of the Basin the Cretaceous units were later covered by stream sediments of the Wind River Formation of Eocene age (34-56 mya) which filled paleo-drainages cut into a paleo-topographic surface. The source of the Wind River sediments is granitic terrain within the nearby Laramie Range to the east and the Shirley Mountains to the southwest. The Wind River Formation was subsequently covered by younger volcanic ash-choked stream sediments of the White River and Arikaree Formations of Oligocene age (23-34 mya) and Miocene age (5-23 mya), respectively.
The Wind River Formation is the host of all uranium mineralization mined within the Shirley Basin mining district. The lithology of the Wind River Formation is characterized by multiple thick, medium to coarse grained sandstones separated by thick claystone shale units. The individual sandstones and shales are typically 20 to 50 feet thick. Total thickness of the Wind River Formation ranges from approximately 400 to 500 feet. The two most dominant sandstones are named the Main and Lower Sands. The Lower Sand represents the basal sand unit of the Wind River Formation and in places lies directly above the underlying Cretaceous formations.
Uranium occurs as roll front type deposits along the edge of large regional alteration systems within sandstone units of the Wind River Formation. The source of the uranium is considered to be the volcanic ash content within the overlying White River Formation and also granitic content within the Wind River Formation itself. The Main and Lower Sands are the primary hosts to mineralization which we are currently targeting for ISR development. Studies we conducted in 2014, as well as previous studies by Pathfinder in the late 1990s, indicate that this mineralization is amenable to ISR extraction. The primary target is called the FAB Trend which
19
represents the connecting mineral trend between two past-produced open-pits. A secondary target called Area 5 was also an ISR target for Pathfinder prior to shut-down of their mining operations in 1992.
Lost Soldier Project – Great Divide Basin, Wyoming
Acquired in 2005, the Lost Soldier project is located approximately 14 miles (22.5 kilometers) to the northeast of the Lost Creek Project. Lost Soldier has over 3,700 historic drill holes defining 14 mineralized sandstone units. We maintain 143 unpatented mining claims at Lost Soldier, totaling approximately 2,710 mineral acres. While we don’t currently view this property as individually material, we anticipate that further technical work on Lost Soldier will continue to be completed as corporate priorities are determined for the exploration and development of the Lost Creek Property and Shirley Basin, and funding may be allocated to the Lost Soldier project.
The Bootheel Project, LLC and The Bootheel Project – Shirley Basin, Wyoming
Jet Metal Corp., formerly Crosshair Energy Corporation (“Jet Metal”) has been the manager of The Bootheel Project, LLC venture since 2007. Following a decision to not fund our portion of the budget for the venture’s budget year ending March 31, 2012, our ownership interest was reduced from 25% to approximately 19%. Since that budget year, we have participated in the project’s budgets and programs, although both programs have been nominal maintenance programs. In February 2013, the private mineral lease agreements for the Bootheel property of the project expired and were not renewed. Portions of the minerals included in the technical report issued by Crosshair, are located on the leased lands at the Bootheel property. In June 2013, the Management Committee of the Bootheel Project chose to abandon certain unpatented mining claims at the Bootheel property, while retaining mining claims and the State of Wyoming uranium lease on which the remaining mineral resource is located. There is no reported mineral resource at the Buck Point property. In June 2013, the Management Committee determined to abandon all unpatented mining claims at Buck Point. Subsequently, the State of Wyoming mineral lease at Buck Point was relinquished. As a result, Ur-Energy’s investment in the Buck Point property was written off in 2013, at the same time that an impairment analysis of the remaining investment at the Bootheel property resulted in a $37,000 write-down because it was determined that the carrying cost was greater than the enterprise value of the underlying mineral resource. There was no activity other than land maintenance (payment of maintenance for unpatented mining claims and of state lease rentals) during 2014. We do not anticipate further exploration or development work being conducted during 2015.
20
Competition and Mineral Prices
The uranium industry is highly competitive, and our competition includes larger, more established companies with longer operating histories that not only explore for and produce uranium, but also market uranium and other products on a regional, national or worldwide basis. Because of their greater financial and technical resources, competitive bidding processes involving such companies will be challenging; this competition extends to the further acquisition of properties and also equipment, contractors and personnel required to explore and develop such properties. Additionally, these larger companies have greater resources to continue with their operations during periods of depressed market conditions.
Unlike other commodities, uranium does not trade on an open market. Contracts are negotiated privately by buyers and sellers. Our existing long-term agreements are described in Item 1, above and in Item 7, below. Uranium prices are published by two of the leading industry-recognized independent market consultants, The Ux Consulting Company, LLC and TradeTech, LLC, who publish on their respective websites. The following information reflects an average of the per pound prices published by these two consulting groups for the timeframe indicated:
|
December 31 of [year] |
2009 |
2010 |
2011 |
2012 |
2013 |
2014 |
|
Spot price (US$) |
$ 44.50 |
$ 62.25 |
$ 51.88 |
$ 43.38 |
$ 34.50 |
$ 35.50 |
|
LT price (US$) |
$ 61.00 |
$ 66.00 |
$ 62.00 |
$ 56.50 |
$ 50.00 |
$ 49.50 |
|
End of [month] |
Aug-14 |
Sep-14 |
Oct-14 |
Nov-14 |
Dec-14 |
Jan-15 |
Feb.22 (wk of 3.2.15) |
|
Spot price (US$) |
$ 31.50 |
$ 35.40 |
$ 36.68 |
$ 39.50 |
$ 35.50 |
$ 37.00 |
$ 38.38 |
|
LT price (US$) |
$ 44.00 |
$ 45.00 |
$ 45.00 |
$ 49.50 |
$ 49.50 |
$ 49.50 |
$ 49.50 |
Government Regulation
As set forth above, our exploration projects and operations at Lost Creek and our other projects in Wyoming where exploration, development and operations are taking place, are subject to extensive laws and regulations which are overseen and enforced by multiple federal, state and local authorities. These laws govern exploration, development, production, exports, various taxes, labor standards, occupational health and safety, waste disposal, protection and remediation of the environment, protection of endangered and protected species, toxic and hazardous substances and other matters. Uranium minerals exploration is also subject to risks and liabilities associated with pollution of the environment and disposal of waste products occurring as a result of mineral exploration and production.
Compliance with these laws and regulations may impose substantial costs on us and will subject us to significant potential liabilities. Changes in these regulations could require us to expend significant resources to comply with new laws or regulations or changes to current requirements and could have a material adverse effect on our business operations.
21
Minerals exploration and development activities are subject to comprehensive regulation which may cause substantial delays or require capital outlays in excess of those anticipated, causing an adverse effect on our business operations. Minerals exploration operations are also subject to federal and state laws and regulations which seek to maintain health and safety standards by regulating the design and use of drilling methods and equipment. Various permits from government bodies are required for drilling operations to be conducted; no assurance can be given that such permits will be received. Environmental standards imposed by federal and state authorities may be changed and any such changes may have material adverse effects on our activities. Minerals extraction operations are subject to federal and state laws relating to the protection of the environment, including laws regulating removal of natural resources from the ground and the discharge of materials into the environment. As of this date, other than with respect to the posting of a performance bond and the costs associated with our permitting and licensing activities, we have not been required to spend material amounts on compliance with environmental regulations. However, we may be required to do so in future and this may affect our ability to expand or maintain our operations.
Environment Regulations
As set forth above, our mineral projects are the subject of extensive environmental regulation at federal, state and local levels.
Exploration, development and production activities are subject to certain environmental regulations which may prevent or delay the commencement or continuance of our operations. In general, our exploration and production activities are subject to certain federal and state laws and regulations relating to environmental quality and pollution control. Such laws and regulations increase the costs of these activities and may prevent or delay the commencement or continuance of a given operation. Compliance with these laws and regulations has not had a material effect on our operations or financial condition to date. Specifically, we are subject to legislation and regulations regarding radiation safety, emissions into the environment, water discharges, and storage and disposition of hazardous wastes. In addition, legislation requires well and facility sites to be abandoned and reclaimed to the satisfaction of state and federal authorities.
Waste Disposal
The Resource Conservation and Recovery Act ("RCRA"), and comparable state statutes, affect minerals exploration and production activities by imposing regulations on the generation, transportation, treatment, storage, disposal and cleanup of hazardous wastes and on the disposal of non-hazardous wastes. Under the auspices of the United States Environmental Protection Agency (the "EPA"), the individual states administer some or all of the provisions of RCRA, sometimes in conjunction with their own, more stringent requirements.
Underground Injection Control ("UIC") Permits
The federal Safe Drinking Water Act (“SDWA”) creates a nationwide regulatory program protecting groundwater. This act is administered by the EPA. However, to avoid the burden of dual federal and state regulation, the Safe Drinking Water Act allows for the UIC permits issued by states to satisfy the UIC permit required under the Safe Drinking Water Act under two conditions. First, the state's program must have been granted primacy, as is the case in Wyoming. Second, the EPA must have granted, upon request by the state, an aquifer exemption. The EPA may delay or decline to process the state's application if the EPA questions the state's jurisdiction over the mine site. The EPA commenced a rulemaking with its publication of 40 CFR Part 192 rules in early 2015. These proposed rules effectively seek to expand EPA jurisdiction in restoration of groundwater within an exempted aquifer, and propose to extend the time for monitoring such restoration and stabilization requirement for as much as thirty years following production. As proposed, the rules implicate
22
RCRA, SDWA and Uranium Mill Tailings Radiation Control Act (UMTRCA) standards. The rulemaking is likely to take substantial time to complete and it is uncertain what the final rules will require. It is not unlikely that additional requirements with attendant costs will result.
CERCLA
The federal Comprehensive Environmental Response, Compensation and Liability Act ("CERCLA") imposes joint and several liability for costs of investigation and remediation and for natural resource damages, without regard to fault or the legality of the original conduct, on certain classes of persons with respect to the release into the environment of substances designated under CERCLA as hazardous substances ("Hazardous Substances"). These classes of persons or potentially responsible parties include the current and certain past owners and operators of a facility or property where there is or has been a release or threat of release of a Hazardous Substance and persons who disposed of or arranged for the disposal of the Hazardous Substances found at such a facility. CERCLA also authorizes the EPA and, in some cases, third parties to take actions in response to threats to the public health or the environment and to seek to recover the costs of such action. We may also in the future become an owner of facilities on which Hazardous Substances have been released by previous owners or operators. We may in the future be responsible under CERCLA for all or part of the costs to clean up facilities or property at which such substances have been released, and for natural resource damages.
Air Emissions
Our operations are subject to state and federal regulations for the control of emissions of air pollution. Major sources of air pollutants are subject to more stringent, federally imposed permitting requirements. Administrative enforcement actions for failure to comply strictly with air pollution regulations or permits are generally resolved by payment of monetary fines and correction of any identified deficiencies. Alternatively, regulatory agencies could require us to forego construction, modification or operation of certain air emission sources.
Clean Water Act
The Clean Water Act ("CWA") imposes restrictions and strict controls regarding the discharge of wastes, including mineral processing wastes, into waters of the United States, a term broadly defined. Permits must be obtained to discharge pollutants into federal waters. The CWA provides for civil, criminal and administrative penalties for unauthorized discharges of hazardous substances and other pollutants. It imposes substantial potential liability for the costs of removal or remediation associated with discharges of oil or hazardous substances. State laws governing discharges to water also provide varying civil, criminal and administrative penalties, and impose liabilities in the case of a discharge of petroleum or its derivatives, or other hazardous substances, into state waters. In addition, the EPA and the State of Wyoming have promulgated regulations that require us to obtain permits to discharge storm water runoff. In the event of an unauthorized discharge of wastes, we may be liable for penalties and costs.
Employees
At December 31, 2014, Ur-Energy USA employed 28 people in its Littleton, Colorado (14) and Casper, Wyoming (14) offices. Lost Creek ISR, LLC employed 56 people at the Lost Creek Culver-Douglas Uranium Recovery Facility near Wamsutter, Wyoming. None of our other subsidiaries had employees in 2014.
23
Corporate Offices
The registered office of Ur-Energy is located at 55 Metcalfe Street, Suite 1300, Ottawa, Ontario K1P 6L5. Our United States corporate headquarters is located at 10758 West Centennial Road, Suite 200, Littleton, Colorado, 80127. We maintain a corporate and operations office at 5880 Enterprise Drive, Suite 200, Casper, Wyoming 82609. Lost Creek operational offices are located at the Culver-Douglas Uranium Recovery Facility, 3424 Wamsutter / Crooks Gap Road, Wamsutter, Wyoming 82336.
Available Information
Detailed information about Ur-Energy is contained in our annual reports, quarterly reports, current reports on Form 8‑K, and other reports, and amendments to those reports that we file with or furnish to the SEC and the Canadian regulatory authorities. These reports are available free of charge on our website, www.ur-energy.com, as soon as reasonably practicable after we electronically file such reports with or furnish such reports to the SEC and the Canadian regulatory authorities. However, our website and any contents thereof should not be considered to be incorporated by reference into this Annual Report on Form 10-K.
We will furnish copies of such reports free of charge upon written request to our Corporate Secretary:
Ur-Energy Inc.
Attention: Corporate Secretary
10758 West Centennial Road, Suite 200
Littleton, Colorado 80127
Telephone: 1-866-981-4588
Email: legaldept@ur-energy.com
Additionally, our corporate governance guidelines, Code of Ethics and the charters of each of the standing committees of our Board of Directors are available on our website. We will furnish copies of such information free of charge upon written request to our Corporate Secretary, as set forth as above.
Other information relating to Ur-Energy may be found on the SEC’s website at http://www.sec.gov/edgar.shtml or on the SEDAR website at www.sedar.com. Our reports can be read and copied by the public at the SEC’s Public Reference Room at 100 F Street, NE., Washington, D.C. 20549.
24
An investment in our securities involves a high degree of risk. You should consider the following discussion of risks in addition to the other information in this annual report before purchasing any of our securities. In addition to historical information, the information in this annual report contains “forward-looking” statements about our future business and performance. Our actual operating results and financial performance may be very different from what we expect as of the date of this annual report. The risks below address material factors that may affect our future operating results and financial performance.
Risks Related to Our Business
Mining operations involve a high degree of risk.
Mining operations generally involve a high degree of risk. We continue to ramp up our production activities at our first uranium in situ recovery facility at Lost Creek, where production activities commenced in the second half of 2013. Our operations at Lost Creek and other projects as they continue in development will be subject to all the hazards and risks normally encountered in the production of uranium by in situ methods of recovery, including unusual and unexpected geological formations, unanticipated metallurgical difficulties, water management including waste water disposal capacity, equipment malfunctions, other conditions involved in the drilling and removal of material through pressurized injection and production wells, radiation safety and industrial accidents, any of which could result in damage to, or destruction of, mines and other producing facilities, damage to life or property, environmental damage and possible legal liability.
Our property interests and our projects are subject to volatility in the price of uranium.
The price of uranium is volatile. Changes in the price of uranium depend on numerous factors beyond our control including international, economic and political trends; changes in public acceptance of nuclear power generation as a result of any future accidents or terrorism at nuclear facilities, including the longer-term effects on the market due to the events following the earthquake and tsunami affecting the Fukushima nuclear plant in Japan; changes in governmental regulations; expectations of inflation; currency exchange fluctuations; interest rates; global or regional consumption patterns; speculative activities and increased production due to new extraction developments and improved extraction and production methods. The effect of these factors on the price of uranium, and therefore on the economic viability of our properties cannot accurately be predicted. Because most of our properties are in exploration and development stage and Lost Creek commenced operations just over a year ago, it is not yet possible for us to control the impact of fluctuations in the price of uranium.
Our business is subject to extensive environmental regulations that may make exploring, mining or related activities expensive, and which may change at any time.
Environmental legislation and regulation is evolving in a manner which will require stricter standards and enforcement, increased fines and penalties for non-compliance, more stringent environmental assessments of proposed projects and a heightened degree of responsibility for companies and their officers, directors and employees. Included in this evolution are the possible listing of the greater sage-grouse as an endangered species, EPA rules promulgated relating to maintenance of tailings facilities and holding ponds, as well as UMTRCA, RCRA and SDWA restoration and stabilization requirements, all as discussed elsewhere in this annual report. These are not the only laws and regulations which are the subject of discussion and proposed more restrictive changes. Moreover, compliance with environmental quality requirements and reclamation laws imposed by federal, state, provincial, and local governmental authorities may require significant capital outlays, materially affect the economics of a given property, cause material changes or delays in intended activities, and
25
potentially expose us to litigation and other legal or administrative proceedings. We cannot accurately predict or estimate the impact of any such future laws or regulations, or future interpretations of existing laws and regulations, on our operations. Historic exploration activities have occurred on many of our properties and mining and energy production activities have occurred near certain of our properties. If such historic activities have resulted in releases or threatened releases of regulated substances to the environment, or historic activities require remediation, potential for liability may exist under federal or state remediation statutes.
The uranium mining industry is capital intensive, and we may be unable to raise necessary additional funding.
Additional funds likely may be required to fund working capital or to fund exploration and development activities at our properties other than Lost Creek, including Shirley Basin. Potential sources of future funds available to us, in addition to the sales proceeds from Lost Creek production, include the sale of additional equity capital, proceeds from the exercise of outstanding convertible equity instruments, borrowing of funds or other debt structure, project financing, or the sale of our interests in assets. There is no assurance that such funding will be available to us to continue development or future exploration. Furthermore, even if such financing is successfully completed, there can be no assurance that it will be obtained on terms favorable to us or will provide us with sufficient funds to meet our objectives, which may adversely affect our business and financial position. In addition, any future equity financings may result in substantial dilution for our existing shareholders.
Our mineral resource estimates may not be reliable and we need to develop additional resources to sustain ongoing operations.
Until reserves or resources are actually mined and processed, the quantity of resources and grades must be considered as estimates only. There are numerous uncertainties inherent in estimating quantities of resources, including many factors beyond our control, and no assurance can be given that the recovery of estimated reserves or resources will be realized. In general, estimates of resources are based upon a number of factors and assumptions made as of the date on which the estimates were determined, including:
|
· |
geological and engineering estimates that have inherent uncertainties and the assumed effects of regulation by governmental agencies; |
|
· |
the judgment of the geologists, engineers and other professionals preparing the estimate; |
|
· |
estimates of future uranium prices and operating costs; |
|
· |
the quality and quantity of available data; |
|
· |
the interpretation of that data; and |
|
· |
the accuracy of various mandated economic assumptions, all of which may vary considerably from actual results. |
All estimates are, to some degree, uncertain. For these reasons, estimates of the recoverable mineral resources prepared by different engineers or by the same engineers at different times, may vary substantially. As such, there is significant uncertainty in any mineral resource estimate and actual deposits encountered and the economic viability of a deposit may differ materially from our estimates.
As well, because we are now in operation and are depleting our known resource at Lost Creek, we must continue to conduct exploration and develop additional mineral resources. While there remain large areas of Lost Creek Property which require additional exploration, and we have identified mineral resources at our Shirley Basin Project (which is still in the exploration stage), we will need to continue to explore our other mineral properties
26
in Wyoming or acquire additional, known mineral resource properties to replenish our mineral resources and sustain continued operations.
Restrictive covenants in agreements governing our indebtedness may restrict our ability to pursue our business strategies.
Our State Bond Loan and the RMBAH facility, under which we have received approximately $44 million in debt financing, include restrictive covenants that, among other things, limit our ability to sell the assets securing our indebtedness or to incur additional indebtedness other than permitted indebtedness, which may restrict our ability to pursue certain business strategies from time to time. If we do not comply with these covenants, we could be in default which, if not addressed or waived, could require accelerated repayment of our indebtedness.
If we are unable to service our indebtedness, we could lose the assets securing our indebtedness.
Our ability to make scheduled payments and satisfy other covenants (including financial covenants) in the State Bond Loan and the RMBAH facility depends on our financial condition and operating performance, which are subject to prevailing economic, competitive, legislative and regulatory conditions beyond our control. We may be unable to generate a level of cash flow from operating activities sufficient to permit us to pay the principal, interest and other fees on our indebtedness.
If we cannot make scheduled payments on our debt, we will be in default which, if not addressed or waived, could require accelerated repayment of our indebtedness and the enforcement by the lenders against the assets securing our indebtedness. The secured collateral includes the Lost Creek assets (State Bond Loan) and the Pathfinder assets (RMBAH facility). These are key assets on which our business is substantially dependent and as such, the enforcement against any one or all of these assets would have a material adverse effect on our operations and financial condition.
Our mining operations are subject to numerous environmental laws, regulations and permitting requirements and bonding requirements that can delay production and adversely affect operating and development costs.
Our business is subject to extensive federal, state, provincial and local laws governing prospecting and development, taxes, labor standards and occupational health, mine and radiation safety, toxic substances, environmental protection, endangered species protections, and other matters. Exploration, development and production operations are also subject to various federal, state, provincial and local laws and regulations relating to the protection of the environment. These laws impose high standards on the mining industry, and particularly to uranium recovery, to monitor the discharge of waste water and report the results of such monitoring to regulatory authorities, to reduce or eliminate certain effects on or into land, water or air, to progressively restore mine properties, to manage hazardous wastes and materials and to reduce the risk of worker accidents. A violation of these laws may result in the imposition of substantial fines and other penalties and potentially expose us to operational restrictions, suspension, administrative proceedings or litigation. Many of these laws and regulations have tended to become more stringent over time. Any change in such laws could have a material adverse effect on our financial condition, cash flow or results of operations. There can be no assurance that we will be able to meet all the regulatory requirements in a timely manner or without significant expense or that the regulatory requirements will not change to delay or prohibit us from proceeding with certain exploration, development or operations. Further, there is no assurance that we will not face new challenges by third parties to regulatory decisions when made, which may cause additional delay and substantial expense, or may cause a project to be permanently halted.
27
Many of our operations require licenses and permits from various governmental authorities. We believe we hold all necessary licenses and permits to carry on the activities which we are currently conducting or propose to conduct under applicable laws and regulations. Such licenses and permits are subject to changes in regulations and changes in various operating circumstances. There can be no guarantee that we will be able to obtain all necessary licenses and permits that may be required to maintain our exploration and mining activities including constructing mines or milling facilities and commencing or continuing exploration or mining activities or operations at any of our properties. In addition, if we proceed to production on any other exploration property, we must obtain and comply with permits and licenses which will contain specific operating conditions. There can be no assurance that we will be able to obtain such permits and licenses or that we will be able to comply with any such conditions.
Lack of acceptance of nuclear energy and deregulation of the electrical utility industry could impede our business.
Our future prospects are tied directly to the electrical utility industry worldwide. Deregulation of the utility industry, particularly in the United States and Europe, is expected to affect the market for nuclear and other fuels for years to come, and may result in a wide range of outcomes including the expansion or the premature shutdown of nuclear reactors. Maintaining the demand for uranium at current levels and future growth in demand will depend upon the continued acceptance of the nuclear technology as a means of generating electricity. Lack of continued public acceptance of nuclear technology would adversely affect the demand for nuclear power and potentially increase the regulation of the nuclear power industry. Following the events of March 2011 in Fukushima Japan, a reaction worldwide called into question the public’s confidence in nuclear energy and technology, the effects of which are still apparent in many countries around the world.
The uranium market is volatile with limited customers.
The marketability of uranium and acceptance of uranium mining is subject to numerous factors beyond our control. The price of uranium may experience volatile and significant price movements over short periods of time. Factors affecting the market include demand for nuclear power; changes in public acceptance of nuclear power generation as a result of any future accidents or terrorism at nuclear facilities, including the continuing effects on the market due to the events following the earthquake and tsunami in Japan in March 2011; political and economic conditions in uranium mining, producing and consuming countries; costs and availability of financing of nuclear plants; reprocessing of spent fuel and the re-enrichment of depleted uranium tails or waste, sales of excess civilian and military inventories (including from the dismantling of nuclear weapons) by governments and industry participants; and production levels and costs of production in geographical areas such as Russia, Kazakhstan, Africa and Australia.
The results of exploration and ultimate production are highly uncertain.
The exploration for, and development of, mineral deposits involves significant risks which a combination of careful evaluation, experience and knowledge may not eliminate. Few properties which are explored are ultimately developed into producing mines. Major expenses may be required to establish mineral resources or reserves, to develop metallurgical processes and to construct mining and processing facilities at a particular site. It is impossible to ensure that our current exploration and development programs will result in profitable commercial operations.
Whether a mineral deposit will be commercially viable depends on a number of factors, some of which are the particular attributes of the deposit, such as size, grade and proximity to infrastructure, as well as uranium prices, which are highly cyclical, and government regulations, including regulations relating to prices, taxes, royalties,
28
land tenure, land use, importing and exporting of uranium and environmental protection. The exact effect of these factors cannot be accurately predicted, but the combination of these factors may result in us not receiving an adequate return on invested capital.
We are subject to risks associated with litigation and other legal proceedings.
Defense and settlement costs of legal claims can be substantial, even with respect to claims that have no merit. From time to time, we may be involved in disputes with other parties which may result in litigation or other proceedings. Additionally, it is not unlikely that we may find ourselves involved directly or indirectly in legal proceedings, in the form of administrative proceedings or litigation, arising from challenges to regulatory actions as described elsewhere in this annual report. Such administrative proceedings and litigation related to regulatory matters may delay or halt exploration or development of our projects. The results of litigation or any other proceedings cannot be predicted with certainty. If we are unable to resolve any such disputes favorably, it could have a material adverse effect on our financial position, ability to operate, results of operations or our property development.
The uranium industry is highly competitive and is competitive with other energy sources.
The international uranium industry is highly competitive. Our activities are directed toward the search, evaluation, acquisition and development of uranium deposits into production operations. There is no certainty that the expenditures to be made by us will result in discoveries of commercial quantities of uranium deposits. There is aggressive competition within the mining industry for the discovery and acquisition of properties considered to have commercial potential. We will compete with other interests, many of which have greater financial resources than we have, for the opportunity to participate in promising projects. Significant capital investment is required to achieve commercial production from successful exploration and development efforts.
Nuclear energy competes with other sources of energy, including oil, natural gas, coal, hydro-electricity and renewable energy sources. These other energy sources are to some extent interchangeable with nuclear energy, particularly over the longer term. Lower prices of oil, natural gas, coal and hydro-electricity may result in lower demand for uranium concentrate and uranium conversion services. Furthermore, the growth of the uranium and nuclear power industry beyond its current level will depend upon continued and increased acceptance of nuclear technology as a means of generating electricity. Because of unique political, technological and environmental factors that affect the nuclear industry, the industry is subject to public opinion risks which could have an adverse impact on the demand for nuclear power and increase the regulation of the nuclear power industry.
29
Our property title may be uncertain and could be challenged.
Although we have obtained title opinions with respect to certain of our properties, there is no guarantee that title to any of our properties will not be challenged or impugned. Third parties may have valid claims underlying portions of our interests. Our mineral properties in the United States consist of leases to private mineral rights, leases covering state lands, unpatented mining claims and patented mining claims. Many of our mining properties in the United States are unpatented mining claims to which we have only possessory title. Because title to unpatented mining claims is subject to inherent uncertainties, it is difficult to determine conclusively ownership of such claims. These uncertainties relate to such things as sufficiency of mineral discovery, proper posting and marking of boundaries and possible conflicts with other claims not determinable from descriptions of record. The present status of our unpatented mining claims located on public lands allows us the exclusive right to mine and remove valuable minerals. We are allowed to use the surface of the public lands solely for purposes related to mining and processing the mineral-bearing ores. However, legal ownership of the land remains with the United States. We remain at risk that the mining claims may be forfeited either to the United States or to rival private claimants due to failure to comply with statutory requirements. We have taken or will take appropriate curative measures to ensure proper title to our properties where necessary and where possible.
Possible amendments to the General Mining Law could make it more difficult or impossible for us to execute our business plan.
Members of the United States Congress have repeatedly introduced bills which would supplant or alter the provisions of the United States Mining Law of 1872, as amended. Such bills have proposed, among other things, to (i) either eliminate or greatly limit the right to a mineral patent; (ii) significantly alter the laws and regulations relating to uranium mineral development and recovery from unpatented and patented mining claims; (iii) impose a federal royalty on production from unpatented mining claims; (iv) impose time limits on the effectiveness of plans of operation that may not coincide with mine life, (v) impose more stringent environmental compliance and reclamation requirements on activities on unpatented mining claims, (vi) establish a mechanism that would allow states, localities and Native American tribes to petition for the withdrawal of identified tracts of federal land from the operation of the U.S. general mining laws, and (vii) allow for administrative determinations that mining would not be allowed in situations where undue degradation of the federal lands in question could not be prevented.
If enacted, such legislation could change the cost of holding unpatented mining claims and could significantly impact our ability to develop locatable mineral resources on our patented and unpatented mining claims. Although it is impossible to predict at this point what any legislated royalties might be, enactment could adversely affect the potential for development and the economics of existing operating mines. Passage of such legislation could adversely affect our financial performance.
Additionally, as noted in other risk factors, there are currently proposed withdrawals of federal lands for the purposes of mineral location and development. While such proposals are not yet final and would require further Congressional action, if they were to occur, it is uncertain whether such withdrawals would affect in any manner our current mineral projects in Wyoming.
Acquisitions and integration may disrupt our business.
From time to time, we examine opportunities to acquire additional mining assets and businesses. Any acquisition that we may choose to complete may be of significant size, may change the scale of our business and operations, and/or may expose us to new geographic, political, operating, financial and geological risks. Any acquisitions would be accompanied by risks. For example, there may be a significant change in commodity
30
prices after we have committed to complete the transaction and established the purchase price or exchange ratio; a material ore body may prove to be below expectations; we may have difficulty integrating and assimilating the operations and personnel of any acquired company, realizing anticipated synergies and maximizing the financial and strategic position of the combined enterprise, and maintaining uniform standards, policies and controls across the organization; the integration of the acquired business or assets may disrupt our ongoing business and relationships with employees, customers, suppliers and contractors; and the acquired business or assets may have unknown liabilities which may be significant. There can be no assurance that we would be successful in overcoming these risks or any other problems encountered in connection with such acquisitions.
We do not have an earnings record, and we have never paid dividends.
We do not have an established earnings record, having only commenced operations in the second half of 2013. We have not paid dividends on our Common Shares since incorporation and do not anticipate doing so in the foreseeable future. Payments of any dividends will be at the discretion of our Board after taking into account many factors, including our financial condition and current and anticipated cash needs.
We depend on the services of our management, key personnel, contractors and service providers.
Shareholders will be relying on the good faith, experience and judgment of our management and advisors in supervising and providing for the effective management of the business and our operations and in selecting and developing new investment and expansion opportunities. We may need to recruit additional qualified employees, contractors and service providers to supplement existing management and personnel, the availability of which cannot be assured, particularly in the current labor markets in which we recruit our employees and the somewhat remote locations for which employees are needed. As well, the skilled professionals with expertise in engineering and process aspects of in situ recovery, radiation safety and other facets of our business are currently in high demand, as there are relatively few such professionals with both expertise and experience. We will need to hire additional employees as we develop the Shirley Basin Project. We will continue to be dependent on a relatively small number of key persons, including key contractors, the loss of any one or several of whom could have an adverse effect on our business and operations. We do not hold key man insurance in respect of any of our executive officers.
Our insurance coverage could be insufficient.
We currently carry insurance coverage for general liability, directors’ and officers’ liability and other matters. We intend to carry insurance to protect against certain risks in such amounts as we consider adequate. Certain insurances may be cost prohibitive to maintain, and even if we carried all such insurances, the nature of the risks we face in our exploration and uranium production operations is such that liabilities could exceed policy limits in any insurance policy or could be excluded from coverage under an insurance policy. The potential costs that could be associated with any liabilities not covered by insurance or in excess of insurance coverage or compliance with applicable laws and regulations may cause substantial delays and require significant capital outlays, adversely affecting our business and financial position.
We are dependent on information technology systems, which are subject to certain risks.
We depend upon information technology systems in a variety of ways throughout our operations. Any significant breakdown of those systems, whether through virus, cyber-attack, security breach, theft, or other destruction, invasion or interruption, or unauthorized access to our systems, could negatively impact our business and operations. To the extent that such invasion, cyber-attack or similar security breach results in disruption to our operations, loss or disclosure of, or damage to, our data and particularly our confidential or proprietary information, our reputation, business, results of operations and financial condition could be
31
materially adversely affected. Our systems, internal controls and insurance for protecting against such cyber security risks may be insufficient. Although to date we have experienced no such attack resulting in material losses, we may suffer such losses at any time in the future. We may be required to expend significant additional resources to continue to modify and enhance our protective measures or to investigate, restore or remediate any information technology security vulnerabilities.
U.S. Federal Income Tax Consequences to U.S. Shareholders under the Passive Foreign Investment Company Rules
Investors in the Common Shares of Ur-Energy that are U.S. taxpayers (referred to as a U.S. shareholder) should be aware that we may be a “passive foreign investment company” (a “PFIC”) for the period ended December 31, 2014 and may be a PFIC in subsequent years. If we are a PFIC for any year during a U.S. shareholder’s holding period, then such U.S. shareholders generally will be subject to a special, highly adverse tax regime with respect to so-called “excess distributions” received on our Common Shares. Gain realized upon a disposition of our Common Shares (including upon certain dispositions that would otherwise be tax-free) also will be treated as an excess distribution. Excess distributions are punitively taxed and are subject to additional interest charges. Additional special adverse rules also apply to U.S. shareholders who own Common Shares of Ur-Energy if we are a PFIC and have a non-U.S. subsidiary that is also a PFIC (a “lower-tier PFIC”).
A U.S. shareholder may make a timely "qualified electing fund" election (“QEF election”) or a "mark-to-market" election with respect to our Common Shares to mitigate the adverse tax rules that apply to PFICs, but these elections may accelerate the recognition of taxable income and may result in the recognition of ordinary income. To be timely, a QEF election generally must be made for the first year in the U.S. shareholder’s holding period in which Ur-Energy is a PFIC. A U.S. shareholder may make a QEF election only if the U.S. shareholder receives certain information (known as a “PFIC annual information statement”) from us annually. A U.S. shareholder may make a QEF election with respect to a lower-tier PFIC only if it receives a PFIC annual information statement with respect to the lower tier PFIC. The mark-to-market election is available only if our Common Shares are considered regularly traded on a qualifying exchange, which we cannot assure will be the case for years in which it may be a PFIC. The mark-to-market election is not available for a lower-tier PFIC.
We will use commercially reasonable efforts to make available to U.S. Holders, upon their written request: (a) timely and accurate information as to our status as a PFIC and the PFIC status of any subsidiary in which Ur-Energy owns more than 50% of such subsidiary’s total aggregate voting power, and (b) for each year in which Ur-Energy determines that it is a PFIC, upon written request, a PFIC annual information statement with respect to Ur-Energy and with respect to each such subsidiary that we determine is a PFIC.
Special adverse rules that impact certain estate planning goals could apply to our Common Shares if we are a PFIC. Each U.S. shareholder should consult its own tax advisor regarding the U.S. federal, state and local consequences of the PFIC rules, and regarding the QEF and mark-to-market elections.
As a result of the Canadian Foreign Affiliate Dumping Rules, any foreign purchaser of more than 10% of the Common Shares may be subject to adverse Canadian tax consequences.
Section 212.3 of the Tax Act (the “Foreign Affiliate Dumping Rules”) may apply where a corporation resident in Canada (a “CRIC”) that is, or becomes as part of a series of transactions, controlled by, a non-resident corporation (the “Non-Resident Parent”) makes an investment in a “subject corporation”. An investment in a subject corporation includes an acquisition of shares of another CRIC, where in general terms: (i) more than 75% of the fair market value of the other CRIC’s property is comprised of shares of foreign subsidiaries; and (ii) at the time of the acquisition, or as part of the series of transactions, the acquiring CRIC, together with its
32
related parties, indirectly owns at least 10% of the shares of any class of any of the target CRIC’s foreign subsidiaries. Where applicable, the Foreign Affiliate Dumping Rules may deem the acquiring CRIC to have paid a dividend to its Non-Resident Parent that would be subject to Canadian withholding tax, or could potentially reduce the paid-up capital of the shares of the target CRIC.
In the event that Ur-Energy is a CRIC and more than 75% of the fair market value of the Company’s property is comprised of shares of foreign subsidiaries, a potential purchaser of Common Shares: (i) that is itself a CRIC; and (ii) that is controlled by, or that becomes at any time during a series of transactions or events (including a purchase of Common Shares) controlled by, a Non-Resident Parent, should consult its own tax advisor with respect to the potential application of the proposed Foreign Affiliate Dumping Rules in connection with any acquisition of Common Shares.
Item 1B. UNRESOLVED STAFF COMMENTS
None.
None.
Item 4. MINE SAFETY DISCLOSURE
Our operations and other activities at Lost Creek are not subject to regulation by the Federal Mine Safety and Health Administration (“MSHA”) under the Federal Mine Safety and Health Act of 1977 (the “Mine Act”).
33
Item 5. MARKET FOR registrant’s COMMON EQUITY, RELATED STOCKHOLDER MATTERS and issuer purcHases of equity securities
Market Information
Since July 24, 2008, Ur-Energy’s Common Shares have been listed for trading on the NYSE MKT (formerly, NYSE Amex Equities) exchange under the trading symbol “URG.” The following table sets forth the price range per share and trading volume for the Common Shares:
|
|
|
|
|
|
|
NYSE |
||
|
|
Common Shares |
||
|
|
Volume |
High |
Low |
|
Quarter Ending |
|
US$ |
|
|
March 31, 2013 |
11,184,300 | 0.98 | 0.72 |
|
June 30, 2013 |
33,595,300 | 1.34 | 0.74 |
|
September 30, 2013 |
30,110,900 | 1.39 | 0.92 |
|
December 31, 2013 |
35,868,000 | 1.48 | 1.00 |
|
|
|
|
|
|
March 31, 2014 |
73,612,000 | 1.99 | 1.22 |
|
June 30, 2014 |
75,340,500 | 1.69 | 1.00 |
|
September 30, 2014 |
50,474,000 | 1.37 | 1.00 |
|
December 31, 2014 |
34,209,800 | 1.07 | 0.73 |
|
|
|
|
|
|
January 1, 2015 to February 27, 2015 |
8,846,200 | 0.96 | 0.75 |
Since November 29, 2005, Ur-Energy’s Common Shares have been listed and posted for trading on the Toronto Stock Exchange under the trading symbol “URE.” The following table sets forth the price range per share and trading volume for the Common Shares:
|
|
|
|
|
34
|
|
TSX |
||
|
|
Common Shares |
||
|
|
Volume |
High |
Low |
|
Quarter Ending |
|
CDN$ |
|
|
March 31, 2013 |
4,510,300 | 0.98 | 0.73 |
|
June 30, 2013 |
8,373,000 | 1.37 | 0.76 |
|
September 30, 2013 |
8,248,800 | 1.41 | 0.96 |
|
December 31, 2013 |
7,312,500 | 1.57 | 1.02 |
|
|
|
|
|
|
March 31, 2014 |
14,969,500 | 2.21 | 1.36 |
|
June 30, 2014 |
12,264,500 | 1.87 | 1.08 |
|
September 30, 2014 |
5,760,800 | 1.46 | 1.11 |
|
December 31, 2014 |
6,899,900 | 1.22 | 0.83 |
|
|
|
|
|
|
January 1, 2015 to February 27, 2015 |
1,962,800 | 1.19 | 0.94 |
Holders
The authorized capital of Ur-Energy consists of an unlimited number of Common Shares and an unlimited number of Class A Preference Shares. As of March 2, 2014, 129,733,052 Common Shares are issued and outstanding and no preferred shares are issued and outstanding. We estimate that we have approximately 17,300 beneficial holders of our Common Shares. The holders of the Common Shares are entitled to one vote per share at all meetings of our shareholders. The holders of Common Shares are also entitled to dividends, if and when declared by our Board and the distribution of the residual assets of the company in the event of a liquidation, dissolution or winding up.
Our Class A Preference Shares are issuable by the directors in one or more series and the directors have the right and obligation to fix the number of shares in, and determine the designation, rights, privileges, restrictions and conditions attaching to the shares of each series. The rights of the holders of Common Shares will be subject to, and may be adversely affected by, the rights of the holders of any Class A Preference Shares that may be issued in the future. The Class A Preference Shares, may, at the discretion of the Board, be entitled to a preference over the Common Shares and any other shares ranking junior to the Class A Preference Shares with respect to the payment of dividends and distribution of assets in the event of liquidation, dissolution or winding up.
Shareholder Rights Plan
Ur-Energy maintains a shareholder rights plan (the “Rights Plan”) designed to encourage the fair and equal treatment of shareholders in connection with any take-over bid for the company's outstanding securities. The Rights Plan is intended to provide the Board with adequate time to assess a take-over bid, to consider alternatives to a take-over bid as a means of maximizing shareholder value, to allow competing bids to emerge, and to provide our shareholders with adequate time to properly assess a take-over bid without undue pressure. The Rights Plan was reconfirmed by shareholders at Ur-Energy’s annual and special meeting of shareholders on May 10, 2012. It is anticipated that that Rights Plan will be on the agenda for reconfirmation at the upcoming 2015 Annual Meeting of Shareholders.
35
Dividends
To date, we have not paid any dividends on our outstanding Common Shares and have no current intention to declare dividends on the Common Shares in the foreseeable future. Any decision to pay dividends on our Common Shares in the future will be dependent upon our financial requirements to finance future growth, the general financial condition of the company and other factors which our Board may consider appropriate in the circumstances.
Securities Authorized for Issuance under Equity Compensation Plans
The following table sets forth certain summary information concerning our equity compensation plans as at December 31, 2014. Directors, officers, employees, and consultants are eligible to participate in the Option Plan. Directors and employees, including executive officers, are eligible to participate in the RSU Plan.
|
Number of Common Shares to be Issued Upon Exercise of Outstanding Options, Warrants and Rights |
Weighted Average Exercise Price of Outstanding Options, Warrants and Rights |
Number of Common Shares Remaining for Future Issuance (Excluding Common Shares to be Issued Upon Exercise of Outstanding Options, Warrants and Rights) |
|
|
Equity compensation plans approved by securityholders (1) |
17,502,690 |
$ 1.19 |
384,169 |
|
Equity compensation plans not approved by security-holders |
- |
- |
- |
|
(1) |
Our shareholders have approved both the Ur-Energy Inc. Amended and Restated Stock Option Plan 2005, as amended, and the Ur-Energy Inc. Amended Restricted Share Unit Plan. |
|
(2) |
The exercise price represents the weighted exercise price of the 8,468,614 outstanding stock options under the 2005 Stock Option Plan. |
|
(3) |
Represents 247,778 Common Shares remaining available for issuance under the Ur-Energy Inc. Amended and Restated Stock Option Plan 2005 and 136,391 Common Shares available under the Ur-Energy Amended Restricted Share Unit Plan. |
Recent Sales of Unregistered Securities
On December 19, 2013, we closed a private placement through which we issued 4,709,089 share units which comprised one Common Share and one-half warrant for the purchase of Common Shares (for a total of 7,063,634 shares). The issuance of these securities was exempt from the registration requirements of the Securities Act of 1933, as amended (the “Securities Act”) by virtue of Section 4(a)(2) and Regulation D thereof, as a transaction by an issuer not involving a public offering. To the extent that purchasers were outside the United States, reliance was placed on Regulation S. Proceeds from this private placement were used for development and construction of our Lost Creek project and general corporate purposes.
36
On April 4, 2013, we issued 1,000,000 Common Shares, through a private placement, in consideration of a purchase agreement by which we repurchased a royalty interest at the Lost Creek Project. The issuance of these securities was exempt from the registration requirements of the Securities Act by virtue of Section 4(a)(2) and Regulation D thereof, as a transaction by an issuer not involving a public offering.
During the fiscal year ended December 31, 2014, we did not have any sales of securities in transactions that were not registered under the Securities Act.
Issuer Purchases of Equity Securities
The Company did not purchase its own equity securities during the fiscal year ended December 31, 2014.
Performance Graph
The following information in this Item 5 of this Annual Report on Form 10-K is not deemed to be “soliciting material” or to be “filed” with the SEC or subject to the liabilities of Section 8 of the Exchange Act, and will not be deemed to be incorporated by reference into any filing under the Securities Act or the Exchange Act, except to the extent we specifically incorporate it by reference into such a filing.
The following graph illustrates the period from December 31, 2009 to December 31, 2014 and reflects the cumulative shareholder return of an investment in our Common Shares compared to the cumulative return of an investment in (a) the Russell 3000 Index, (b) the NYSE MKT Composite Index, and (c) the average of a peer group consisting of Denison Mines Corp., Uranium Energy Corp., Uranerz Energy Corporation and
37
Uranium Resources, Inc. since December 31, 2009, assuming that US$100 was invested and, where applicable, includes the reinvestment of dividends.
|
2009 |
2010 |
2011 |
2012 |
2013 |
2014 |
|
|
Ur-Energy Inc. |
100 |
378 |
110 |
106 |
178 |
118 |
|
NYSE MKT Index |
100 |
121 |
125 |
129 |
133 |
134 |
|
Russell 3000 |
100 |
115 |
114 |
130 |
170 |
187 |
|
Peer Average |
100 |
289 |
102 |
77 |
160 |
113 |
38
Item 6. SELECTED FINANCIAL DATA
The selected financial data set forth below are derived from our audited consolidated financial statements for the years ended December 31, 2014, 2013, 2012, 2011 and 2010, and should be read in conjunction with those financial statements and the notes thereto. The consolidated financial statements have been prepared in accordance with United States generally accepted accounting principles (“US GAAP”). Reference should also be made to “Item 7. Management's Discussion and Analysis of Financial Condition and Results of Operations.”
SUMMARY OF FINANCIAL CONDITION
(Amounts in thousands of U.S. Dollars except per share data)
|
As of December 31 |
|||||
|
2014 |
2013 |
2012 |
2011 |
2010 |
|
|
Working capital |
(2,645) | (242) | 15,532 | 21,990 | 32,713 |
|
Current assets |
9,346 | 10,432 | 18,210 | 23,566 | 34,047 |
|
Total assets |
104,451 | 105,336 | 69,483 | 64,565 | 75,991 |
|
Current liabilities |
11,991 | 10,674 | 2,678 | 1,576 | 1,334 |
|
Long-term liabilities |
60,359 | 55,998 | 1,168 |
- |
- |
|
Shareholders' equity |
32,101 | 38,664 | 65,637 | 62,989 | 74,657 |
|
Year ended December 31 |
|||||
|
2014 |
2013 |
2012 |
2011 |
2010 |
|
|
Revenue |
29,349 | 7,616 |
Nil |
Nil |
Nil |
|
Net loss for the period |
(8,749) | (30,353) | (17,558) | (16,443) | (15,934) |
|
Loss per common share: |
(0.07) | (0.25) | (0.15) | (0.16) | (0.16) |
|
Cash dividends per common share |
Nil |
Nil |
Nil |
Nil |
Nil |
No dividends were paid during these five years.
39
Item 7. MANAGEMENT’S DISCUSSION AND ANALYSIS OF FINANCIAL CONDITION AND RESULTS OF OPERATION
Business Overview
The following discussion is designed to provide information that we believe necessary for an understanding of our financial condition, changes in financial condition and results of our operations. The following discussion and analysis should be read in conjunction with the accompanying audited consolidated financial statements and related notes. The financial statements have been prepared in accordance with US GAAP.
2014 Developments
Lost Creek Property – Great Divide Basin, Wyoming
Uranium production at Lost Creek was initiated in August 2013. During 2014, 547,992 pounds of U3O8 were dried and drummed at the Lost Creek plant, and ultimately 517,760 pounds were sold to utility customers. Throughout 2014, production head grade exceeded technical projections and averaged 149.5 mg/l U3O8. For the year. Production head grades have exceeded technical projections for all six quarters of production since commencement of operations.
We worked throughout the year to improve plant and wellfield efficiencies based on lessons learned throughout the commissioning process. Flow rates were intentionally reduced at various times during 2014 to effectively manage production rates while the new plant and water management systems were commissioned, including modifications to production practices and disposal capacities. As a part of these practices, we modified filter press use, better utilized our holding ponds and drilled a third deep disposal well. Subsequent to year-end, we have completed the commissioning of the reverse osmosis (“RO”) units.
We initially budgeted to produce approximately 1.0 million pounds of U3O8, and expected to sell approximately one-third of the production into our existing sales agreements. In response to the decline in the spot market during the first half of 2014, we revised our guidance in May to reflect production levels which would permit us to deliver into our contractual commitments, with excess production to be utilized either for future delivery obligations or discretionary transactions.
Work continued in the development of our wellfield, with additional header houses being brought online throughout the year, as production required. At year end, we had seven header houses operational; subsequently two additional header houses were brought online in early 2015. We continued wellfield construction and development in Mine Unit 1 throughout the year. Subsequent to the end of the year, we commenced an exploration drill program at Lost Creek, which is anticipated to include approximately 100 holes.
Lost Creek Regulatory and Legal Proceedings
After receiving notice of final operational clearance from the NRC, we commenced production activities at Lost Creek in August 2013. Subsequent to those final approvals, we have made necessary additional filings for approvals of ongoing operations at Lost Creek (e.g., wellfield development; authorizations related to the new deep disposal well). In September 2014, we filed applications for amendment of all Lost Creek permits and licenses to include recovery from the KM horizon and LC East operations.
40
In November 2012, a Wyoming-based group initiated an administrative proceeding requesting review by the State Director’s Office of the BLM of the Bureau of Land Management’s Record of Decision (“ROD”) (issued in October 2012). The review was completed in May 2014, with a decision affirming the ROD.
Corporate Transactions and Financing Developments
RMB Australia Holdings Limited
We established a banking relationship with RMB Australia Holdings Limited (“RMBAH”) in 2013 which allowed for various financings during 2013. The first facility remained available for redraw related to the Pathfinder acquisition, and $5.0 million was redrawn on the facility in December 2013. Amendments to the facility were agreed to in March 2014, permitting an additional $1.5 million drawdown in March, and a subsequent drawdown of $3.5 million as a revolver facility in August. This loan facility is secured by the Pathfinder assets.
Off Take Sales Agreements
We currently have nine off take sales agreements with various North American utilities. In March 2014, we entered into a uranium sales arrangement for production in 2014 and 2016. This arrangement calls for annual deliveries ranging between 150,000 to 250,000 pounds of uranium concentrate and was amended to include additional deliveries in 2015. More recently, in February 2015, we execute another multi-year agreement for sales of 200,000 pounds of uranium concentrates annually. The February 2015 and March 2014 off take agreements supplement earlier off take arrangements which were completed beginning in 2011.
|
SUMMARY OF OFF TAKE SALES AGREEMENTS |
|
|
Production Year |
Total Pounds Uranium Concentrates Contractually Committed |
|
2015 |
630,000 pounds |
|
2016 |
662,000 pounds |
|
2017 |
600,000 pounds |
|
2018 |
500,000 pounds |
|
2019 |
400,000 pounds |
|
2020 |
200,000 pounds |
Technical Developments
We commissioned and issued an independent, NI 43-101 technical report on Shirley Basin, “Technical Report on Resources Shirley Basin Uranium Project Carbon County, Wyoming” dated August 27, 2014 (the “Shirley Basin Technical Report”). This was the first technical report on mineral resources issued for Shirley Basin. Subsequently, on January 27, 2015, we commissioned and issued a second independent, NI 43-101 report on Shirley Basin: the “Preliminary Economic Assessment Shirley Basin Uranium Project Carbon County, Wyoming,” (“Shirley Basin PEA”). The Shirley Basin PEA suggests the possible viability of the project, based upon analyses of metallurgy and recoverability, engineering, and economics including costs of capital expenditures and operating costs. The Shirley Basin Technical Report was based primarily on analyses of historic drill hole data acquired with the purchase of the property. In addition, we drilled 14 confirmation holes prior to the preparation of the report. The mineral resources for the Shirley Basin Project were estimated in the Technical Report, and considered for economics and recoverability in the Shirley Basin PEA. The mineral
41
resource estimate is set forth above, in Items 1 and 2. Business and Properties – Shirley Basin Project – Shirley Basin.
The Bootheel Project, LLC
In April 2014, the Management Committee of the Bootheel Project determined to continue the ownership and maintenance on the Bootheel property for the fiscal year ending March 31, 2015, which is the fiscal year end of The Bootheel Project, LLC. No additional exploration or development activities are planned at this time.
Management Changes
In March 2014, James A. Bonner joined us as Vice President Geology. Mr. Bonner is a Professional Geologist with 23 years in the uranium exploration and development industry, 3 years in the oil and gas industry and 13 years in environmental engineering consulting. He comes to Ur-Energy having most recently served as Vice President of Exploration for Powertech (USA), Inc. Mr. Bonner is a Registered Professional Geologist and a Certified Professional Geologist, and is a member of the Geological Society of America, the American Institute of Professional Geologists and the Society for Mining, Metallurgy and Exploration. Mr. Bonner received a Bachelor of Science in Geology from the University of Wyoming. John Cash, who has served as our Vice President Regulatory Affairs, Exploration and Geology since 2011, continues to serve the Company as Vice President, Regulatory Affairs.
2014 Results of Operations
U3O8 Sales and Production
During 2014, 596,176 pounds of U3O8 were captured within the Lost Creek plant. 547,992 of those pounds were packaged in drums and 562,533 pounds of the drummed inventory were shipped to the conversion facility where 517,760 pounds were sold to utility customers. Inventory, production and sales figures for the Lost Creek Project are as follows:
42
|
Inventory, Production and Sales Analysis |
Unit |
2014 Q4 |
2014 Q3 |
2014 Q2 |
2014 Q1 |
Year to date |
||||||||||||
|
Pounds captured |
lb |
149,564 | 131,331 | 116,708 | 198,573 | 596,176 | ||||||||||||
|
Ad valorem and severance tax |
$000 |
$ |
1,163 |
$ |
313 |
$ |
212 |
$ |
737 |
$ |
2,425 | |||||||
|
Wellfield cash cost (1) |
$000 |
$ |
881 |
$ |
1,012 |
$ |
912 |
$ |
1,196 |
$ |
4,001 | |||||||
|
Wellfield non-cash cost (1)(2) |
$000 |
$ |
1,350 |
$ |
1,349 |
$ |
1,350 |
$ |
1,350 |
$ |
5,399 | |||||||
|
Ad valorem and severance tax per pound captured |
$/lb |
$ |
7.78 |
$ |
2.38 |
$ |
1.82 |
$ |
3.71 |
$ |
4.07 | |||||||
|
Cash cost per pound captured |
$/lb |
$ |
5.89 |
$ |
7.71 |
$ |
7.81 |
$ |
6.02 |
$ |
6.71 | |||||||
|
Non-cash cost per pound captured |
$/lb |
$ |
9.02 |
$ |
10.28 |
$ |
11.56 |
$ |
6.80 |
$ |
9.06 | |||||||
|
Pounds drummed |
lb |
117,160 | 125,915 | 133,684 | 171,233 | 547,992 | ||||||||||||
|
Plant cash cost (3) |
$000 |
$ |
1,553 |
$ |
1,703 |
$ |
1,625 |
$ |
1,902 |
$ |
6,783 | |||||||
|
Plant non-cash cost (2)(3) |
$000 |
$ |
507 |
$ |
504 |
$ |
502 |
$ |
503 |
$ |
2,016 | |||||||
|
Cash cost per pound drummed |
$/lb |
$ |
13.26 |
$ |
13.53 |
$ |
12.15 |
$ |
11.11 |
$ |
12.38 | |||||||
|
Non-cash cost per pound drummed |
$/lb |
$ |
4.33 |
$ |
4.00 |
$ |
3.76 |
$ |
2.94 |
$ |
3.68 | |||||||
|
Pounds shipped |
lb |
102,071 | 126,499 | 163,747 | 170,216 | 562,533 | ||||||||||||
|
Distribution cash cost (4) |
$000 |
$ |
113 |
$ |
(31) |
$ |
117 |
$ |
152 |
$ |
351 | |||||||
|
Cash cost per pound shipped |
$/lb |
$ |
1.10 |
$ |
(0.24) |
$ |
0.71 |
$ |
0.89 |
$ |
0.62 | |||||||
|
Pounds sold |
lb |
100,000 | 100,000 | 207,760 | 110,000 | 517,760 | ||||||||||||
|
U3O8 sales |
$000 |
$ |
6,603 |
$ |
5,996 |
$ |
7,197 |
$ |
6,723 |
$ |
26,519 | |||||||
|
Average long-term contract price |
$/lb |
$ |
66.03 |
$ |
59.96 |
$ |
34.64 |
$ |
61.12 |
$ |
51.22 | |||||||
|
Average spot price (5) |
$/lb |
$ |
- |
$ |
- |
$ |
- |
$ |
- |
$ |
- |
|||||||
|
Average price per pound sold |
$/lb |
$ |
66.03 |
$ |
59.96 |
$ |
34.64 |
$ |
61.12 |
$ |
51.22 | |||||||
|
Cost of sales (6) |
$000 |
$ |
3,697 |
$ |
3,752 |
$ |
6,761 |
$ |
3,648 |
$ |
17,858 | |||||||
|
Ad valorem and severance tax cost per pound sold |
$/lb |
$ |
3.18 |
$ |
2.52 |
$ |
3.11 |
$ |
3.78 |
$ |
2.48 | |||||||
|
Cash cost per pound sold |
$/lb |
$ |
20.32 |
$ |
20.77 |
$ |
17.45 |
$ |
19.39 |
$ |
19.73 | |||||||
|
Non-cash cost per pound sold (2) |
$/lb |
$ |
13.47 |
$ |
14.23 |
$ |
11.98 |
$ |
9.99 |
$ |
12.28 | |||||||
|
Total cost per pound sold |
$/lb |
$ |
36.97 |
$ |
37.52 |
$ |
32.54 |
$ |
33.16 |
$ |
34.49 | |||||||
Notes:
|
1 |
Wellfield costs include all wellfield operating costs plus amortization of the related mineral property acquisition costs and depreciation of the related asset retirement obligation costs. Wellfield construction and development costs, which include wellfield drilling, header houses, pipelines, power lines, roads, fences and disposal wells, are treated as development expense and are not included in wellfield operating costs. |
|
2 |
Non-cash costs include depreciation of plant equipment, capitalized ARO costs and amortization of the investment in the mineral property acquisition costs. The expenses are calculated on a straight line basis so the expense is constant for each quarter. The cost per pound from these costs will therefore vary based on production levels only. |
|
3 |
Plant costs include all plant operating costs, site overhead costs and depreciation of the related plant construction and asset retirement obligation costs. |
43
|
4 |
Distribution costs include all shipping costs and costs charged by the conversion facility for weighing, sampling, assaying and storing the U3O8 prior to sale. |
|
5 |
There were no spot sales in 2014. |
|
6 |
Cost of sales include all production costs (notes 1, 2 and 3) adjusted for changes in inventory values. |
Cash cost per pound and non-cash cost per pound for produced and sold uranium presented in the table above are non-US GAAP measures. These measures do not have a standardized meaning or a consistent basis of calculation under US GAAP. These measures are used to assess business performance and may be used by certain investors to evaluate performance. To facilitate a better understanding of these measures, the tables below present a reconciliation of these measures to the financial results as presented in our financial statements.
|
|
|
|
|
|
|
|
|
|
|
|
|
|
|
|
|
|
|
|
|
Average Price Per Pound Sold |
|
Unit |
|
|
2014 Q4 |
|
|
2014 Q3 |
|
|
2014 Q2 |
|
|
2014 Q1 |
|
Year to date |
|
|
|
|
|
|
|
|
|
|
|
|
|
|
|
|
|
|
|
|
|
|
|
U3O8 Sales (a) 1 |
|
$ 000
|
|
$ |
6,603 |
|
$ |
5,996 |
|
$ |
7,197 |
|
$ |
6,723 |
|
$ |
26,519 |
|
|
|
|
|
|
|
|
|
|
|
|
|
|
|
|
|
|
|
|
|
|
Pounds sold (b) |
|
lb |
|
|
100,000 |
|
|
100,000 |
|
|
207,760 |
|
|
110,000 |
|
|
517,760 |
|
|
|
|
|
|
|
|
|
|
|
|
|
|
|
|
|
|
|
|
|
|
Average price per pound sold (a ÷ b) |
|
$/lb. |
|
$ |
66.03 |
|
$ |
59.96 |
|
$ |
34.64 |
|
$ |
61.12 |
|
$ |
51.22 |
|
Notes:
|
1 |
Does not include $2.5 million recognized from the gain on assignment of deliveries under long-term contracts because the additional revenue would distort the average realized price per pound (see note 18 to the financial statements). |
U3O8 sales of $26.5 million for the year were based on selling 517,760 pounds at an average price of $51.22, which resulted from meeting all of our contractual delivery requirements with no additional spot sales. We also recognized $2.5 million in revenue from two deliveries which were monetized in 2013, but completed in 2014. Finally, we recognized $0.3 million of disposal fees at the Shirley Basin Project. This resulted in total sales of $29.3 million as reported in the financial statements.
|
|
|
|
|
|
|
|
|
|
|
|
|
|
|
|
|
|
|
|
|
Total Cost Per Pound Sold |
|
Unit |
|
|
2014 Q4 |
|
|
2014 Q3 |
|
|
2014 Q2 |
|
|
2014 Q1 |
|
Year to date |
|
|
|
|
|
|
|
|
|
|
|
|
|
|
|
|
|
|
|
|
|
|
|
Ad valorem and severance taxes |
|
$000 |
|
$ |
1,163 |
|
$ |
314 |
|
$ |
212 |
|
$ |
736 |
|
$ |
2,425 |
|
|
Wellfield costs |
|
$000 |
|
$ |
2,230 |
|
$ |
2,361 |
|
$ |
2,262 |
|
$ |
2,546 |
|
$ |
9,399 |
|
|
Plant costs |
|
$000 |
|
$ |
2,060 |
|
$ |
2,207 |
|
$ |
2,127 |
|
$ |
2,405 |
|
$ |
8,799 |
|
|
Distribution costs |
|
$000 |
|
$ |
112 |
|
$ |
(31) |
|
$ |
117 |
|
$ |
152 |
|
$ |
350 |
|
|
Inventory change |
|
$000 |
|
$ |
(1,868) |
|
$ |
(1,099) |
|
$ |
2,043 |
|
$ |
(2,191) |
|
$ |
(3,115) |
|
|
Cost of sales (a) |
|
$000 |
|
$ |
3,697 |
|
$ |
3,752 |
|
$ |
6,761 |
|
$ |
3,648 |
|
$ |
17,858 |
|
|
|
|
|
|
|
|
|
|
|
|
|
|
|
|
|
|
|
|
|
|
Pounds sold (b) |
|
lb |
|
|
100,000 |
|
|
100,000 |
|
|
207,760 |
|
|
110,000 |
|
|
517,760 |
|
|
|
|
|
|
|
|
|
|
|
|
|
|
|
|
|
|
|
|
|
|
Cost per pound sold (a ÷ b) 1 |
|
$/lb. |
|
$ |
36.97 |
|
$ |
37.52 |
|
$ |
32.54 |
|
$ |
33.16 |
|
$ |
34.49 |
|
|
1 |
The cost per pound sold reflects both cash and non-cash costs, which are combined as cost of sales in the statement of operations included in this filing. The cash and non-cash cost components are identified in the above inventory, production and sales table. |
44
The cost of sales includes ad valorem and severance taxes related to the extraction of uranium, all costs of wellfield, plant and site operations including the related depreciation and amortization of capitalized assets, reclamation and mineral property costs, plus product distribution costs. These costs are also used to value inventory and the resulting inventoried cost per pound is compared to the estimated sales prices based on the contracts or spot sales anticipated for the distribution of the product. Any costs in excess of the calculated market value are charged to cost of sales.
Production costs generally declined throughout the year with the exception of severance and ad valorem taxes. In November 2014, the State of Wyoming retroactively increased the industry factor used in calculating the taxable value of the extracted uranium by 31%. The one-time retroactive adjustment to the tax expense was reflected in the fourth quarter resulting in significantly higher extraction costs per pound in that quarter. In addition, production was lower in the fourth quarter which also resulted in a higher cost per pound as many of our costs are stable regardless of volume. This is reflected in a higher cost per pound sold for the quarter compared to the previous quarters and a higher valuation of the cost per pound in ending inventory. As many of our costs are fixed, a lower production level will result in a higher cost per pound. We would expect to see the cost per pound decrease as production levels increase.
The resulting gross profit for the year was $11.5 million, which represents a gross profit margin of approximately 39%. We had an operating loss of $7.0 million after deducting total operating expenses of $18.5 million (discussed below). After recording interest and other expenses, the final net loss for the year was $8.7 million.
During the year, the WDEQ approved the Shirley Basin and Lucky Mc bonding totaling $12.7 million. We have submitted a bonding renewal application for Lost Creek which is less than what was approved for 2013. Therefore, we do not expect to have an increase in the related bonding or bond collateral. We have placed the applicable surety bonds and increased our restricted cash balances to meet our current surety bonding requirements.
Collections for the year from U3O8 sales totaled $32.2 million including collections on two sales made in late 2013, but collected in 2014. Our cash position at March 2, 2015 was approximately $7.5 million.
Outlook for 2015
The average spot price per pound of U3O8, as reported by Ux Consulting Company, LLC and TradeTech, LLC, for the week of February 25, 2015 was $38.50. As a result of the continuing low spot price environment, we will once again maintain production at levels that will be consistent with our contractual sales obligations, which are 630,000 pounds at an average realizable price of $50.10 per pound in 2015.
Our current production target for 2015 is to maintain an average production rate of approximately 70,000 pounds per month. We expect to produce between 750,000 and 850,000 pounds of U3O8 in 2015. Excess production will be used to build inventory, which may be utilized to complete discretionary spot sales transactions on an as needed basis if market conditions justify it.
In 2014, we sold 517,760 pounds of U3O8 at an average price per pound of $51.22. Our gross margin per pound sold in 2014 was $16.73, or approximately 33%. On a cash basis, our gross margin per pound sold in 2014 was $29.01, or approximately 57%. We expect similar or slightly better margins in 2015.
In January 2015, production head grade continued to exceed technical projections averaging levels of 109 mg/l U3O8. During January, 65,516 pounds of U3O8 were captured within the Lost Creek plant and 50,597 of those
45
pounds were packaged in drums. To date, 146,000 pounds have been sold to customers under existing long-term contracts in 2015.
As at March 2, 2015, our unrestricted cash position was $7.5 million. Given our current cash resources, contracted sales positions and low cash costs per pound, we do not anticipate the need for additional funding in 2015 unless it is advantageous to do so.
Year Ended December 31, 2014 Compared to Year Ended December 31, 2013
The following table summarizes the results of operations for the years ended December 31, 2014 and 2013 (in thousands of U.S. dollars):
|
Year ended December 31, |
||
|
2014 |
2013 |
|
|
$ |
$ |
|
|
Sales |
29,349 | 7,616 |
|
Cost of sales |
(17,858) | (3,096) |
|
Gross profit |
11,491 | 4,520 |
|
Exploration and evaluation expense |
(3,277) | (2,385) |
|
Development expense |
(7,672) | (18,465) |
|
General and administrative expense |
(6,541) | (5,592) |
|
Accretion expense |
(497) | (27) |
|
Write-off of mineral properties |
(483) | (1,430) |
|
Net loss from operations |
(6,979) | (23,379) |
|
Interest income (expense) (net) |
(2,699) | (6,111) |
|
Warrant mark to market gain |
946 |
- |
|
Loss from equity investment |
(5) | (1,022) |
|
Foreign exchange loss |
(12) | 164 |
|
Other loss |
- |
(5) |
|
Net loss |
(8,749) | (30,353) |
|
Loss per share – basic and diluted |
(0.07) | (0.25) |
|
Total cost per pound sold |
34.49 | 34.40 |
46
Sales
We sold a total of 517,760 pounds of U3O8 in 2014 for an average price of $51.22 per pound as compared to 2013 when it sold 90,000 pounds for an average price of $62.92. All sales for both years were associated with long-term offtake contracts at rates stated within the contracts. Sales revenues in 2013 were reduced by ad valorem and sales taxes of $682 thousand ($7.58 per pound). Effective second quarter 2014, we stopped treating those taxes as a reduction in sales revenues, but rather as a cost of sales as the taxes are based on pounds extracted, not sold. While we applied the adjustment retroactively for purposes of inventory calculations, we elected to treat it as an out-of-period adjustment in that quarter and not restate the prior periods.
We recognized sales of $2.5 million and $2.6 million for the years 2014 and 2013, respectively, from deliveries under offtake agreements which had been assigned to a third party during 2013 for cash consideration.
We recognized sales of $300 thousand from disposal fees at the Shirley Basin site in 2014. As the property was acquired in December 2013, there were no disposal fees in 2013.
Cost of sales
The cost of sales includes the wellfield, plant maintenance, site administration and distribution costs associated with the production of U3O8 adjusted for changes in inventory balances. There were no direct costs of sales associated with either the recognition of the deferred revenue from the sale under the offtake contracts or the disposal fees described above. The increase on cost of sales in 2014 is primarily related to the increase in pounds sold over 2013, as 2013 was our initial year of production and only included one sale of uranium made late in the year.
Operating Expenses
Total operating expenses for the fiscal year ended December 31, 2014 were $18.5 million which include exploration and evaluation expense, development expense and general & administrative (“G&A”) expense. These expenses decreased by $9.5 million compared to 2013, which included costs associated with completing the first disposal wells and preparing the wellfields for production.
Exploration and evaluation expense consists of labor and the associated costs of the exploration and evaluation departments as well as land holding and exploration costs including drilling and analysis on properties which have not reached the permitting or operations stage. These expenses increased $0.9 million for the year ended December 31, 2014 compared to 2013. This was primarily due to discontinuing the allocation of labor costs to construction and other development projects. Total cash expenditures for exploration and evaluation were consistent with the prior year. Overall expenditures have been lower in recent years as the focus has been on developing the Lost Creek Project and not on exploration activities. We maintain active geological and evaluation teams, however, who focus on developing our existing properties, such as Shirley Basin, as well as identifying new mineral exploration opportunities.
Development expense includes costs incurred at the Lost Creek Project prior to the receipt of final regulatory approval in October 2013 and costs not directly attributable to construction and production activities, including wellfield construction and development costs. Development expenses decreased by $10.8 million in 2014 compared to 2013. The most significant cost associated with in situ recovery is the cost of constructing and developing the wellfield header houses, production wells, pipelines within the wellfield and to the plant and related facilities, roads, fencing, powerlines, and disposal wells. Of the cost of wellfield construction, which totaled $15.3 million, $12.0 million was included in development expenses in 2013 as a part of the
47
reclassification of wellfield construction costs as non-capital costs pursuant to SEC Industry Guide 7. The costs in 2014 included continuing costs of adding new header houses and completing wells in the production area as well as the drilling and completion of a third disposal well at a cost of approximately $3.2 million. These costs are considered development costs despite potential future benefits as we have no proven and probable mineral reserves as defined by CIM Definition Standards and are precluded from capitalizing these expenses under SEC guidance. These costs will continue to be incurred in future years as we expand and develop new wellfields within the Lost Creek and at other projects.
G&A expense relates to corporate administration, finance, taxation, investor and human relations, and the land and legal functions and consists principally of personnel, facility and support costs. Expenses increased $0.9 million for the year ended December 31, 2014 compared to 2013. This is primarily due to an increase in labor costs of $0.3 million, recording a retirement obligation of $0.5 million, and an increase in outside services including accounting, legal and contracted investor relations of $0.3 million
Write off of mineral properties decreased by $0.9 million from the year 2013. In 2014, we wrote off five Canadian properties and royalties totaling $0.5 million. In 2013, we decided to abandon claims at our South Granite Mountains project in Wyoming and private leases at the Mustang project in Nebraska totaling $1.4 million.
Other Income and Expenses
Interest expense declined by $3.4 million from 2013 to 2014, but this was caused by the write off of loan fees which included the cost of warrants totaling $5.8 million for the year 2013 issued as a part of the loan consideration to RMBAH. Excluding that, interest expense would have increased by $3.8 million due to the payment of a full year’s worth of interest to Sweetwater County Wyoming on their bond loan and interest payments to RMBAH. 2014 interest payment to RMBAH were actually lower in total than in 2013, however RMBAH interest is no longer capitalized as construction period interest and is therefore now included in interest expense.
As a part of a private placement in December 2013 we issued warrants which were priced in U.S. dollars making them a derivative. This liability is revalued quarterly which resulted in a $0.9 million gain from the reduction of the liability in 2014.
Write off of investments in 2013 were $1.0 million as the management of the Bootheel Project venture allowed claims which contained no economic mineralization to lapse on the Bootheel property and all claims at the Buck Point property to lapse. There were no impairments or other write offs of investments in 2014.
Loss per Common Share
Both basic and diluted loss per common share for the year ended December 31, 2014 was $0.07 compared to $0.25 in 2013. The diluted loss per common share is equal to the basic loss per common share due to the anti-dilutive effect of all convertible securities outstanding given that net losses were experienced.
Cost per Pound Sold
The cost per pound of U3O8 sold in 2014 was $34.49 compared to the cost per pound of $34.40 in 2013. Overall the cost per pound actually decreased in 2014 due to increased efficiencies and higher production levels. The reason for the apparent increase was the change in policy to include severance and ad valorem taxes in inventory calculations. A cost per pound of $2.48 was included in the $34.49 cost per pound detailed above in 2014 with
48
no comparable costs in the cost per pound calculation in 2013. Excluding ad valorem and severance taxes, the adjusted 2014 cost per pound was $32.01 as compared to 2013 unadjusted cost per pound of $34.40.
2013 Results of Operations
U3O8 Sales and Production in 2013
During 2013, 190,365 pounds of U3O8 were captured within the Lost Creek plant. 131,216 of those pounds were packaged in drums and 94,827 pounds of the drummed inventory were shipped to the conversion facility where 90,000 pounds were sold to utility customers. Inventory, production and sales figures for the Lost Creek Project are as follows:
49
|
Highlights |
Unit |
2013 |
|
|
|
|
|
Pounds captured within the plant |
lb |
190,365 |
|
Cash cost per pound captured |
$/lb |
$ 4.82
|
|
Non-cash cost per pound captured |
$/lb |
$ 8.36
|
|
Wellfield cash cost 2 |
$000 |
$ 917
|
|
Wellfield non-cash cost 23 |
$000 |
$ 1,592
|
|
|
|
|
|
Pounds packaged in drums |
lb |
131,216 |
|
Cash cost per pound drummed |
$/lb |
$ 16.73
|
|
Non-cash cost per pound drummed |
$/lb |
$ 1.19
|
|
Plant cash cost 4 |
$000 |
$ 2,196
|
|
Plant non-cash cost 34 |
$000 |
$ 156
|
|
|
|
|
|
Pounds shipped to conversion facility |
lb |
94,827 |
|
Cash cost per pound shipped |
$/lb |
$ 0.34
|
|
Non-cash cost per pound shipped |
$/lb |
nil |
|
Distribution cash cost 5 |
$000 |
$ 33
|
|
Distribution non-cash cost 35 |
$000 |
nil |
|
|
|
|
|
Pounds sold |
lb |
90,000 |
|
Average spot price 6 |
$/lb |
n/a |
|
Average long-term contract price |
$/lb |
$ 62.92
|
|
Average price |
$/lb |
$ 62.92
|
|
Average realized price 7 |
$/lb |
$ 55.34
|
|
Net sales 7 |
$000 |
$ 4,981
|
|
|
|
|
|
Cash cost per pound sold |
$/lb |
$ 21.98
|
|
Non-cash cost per pound sold3 |
$/lb |
$ 12.41
|
|
Total cost per pound sold |
$/lb |
$ 34.40
|
|
Cost of sales 8 |
$000 |
$ 3,096
|
Notes:
1Lost Creek commenced production in 2013. There was no production in 2012
2Wellfield costs include all wellfield operating costs plus amortization of the related mineral property acquisition costs and depreciation of the related asset retirement obligation costs. Wellfield construction and development costs, which include wellfield drilling, header houses, pipelines, power lines, roads, fences and disposal wells, are treated as development expense and are not included in wellfield operating costs.
|
3 |
Non-cash costs include depreciation of plant equipment, capitalized ARO costs and amortization of the investment in the mineral property acquisition costs. The expenses are calculated on a straight line basis so the expense is constant for each quarter. The cost per pound from these costs will therefore vary based on production levels only. |
4Plant costs include all plant operating costs, site overhead costs and depreciation of the related plant construction and asset retirement obligation costs.
5Distribution costs include all shipping costs and costs charged by the conversion facility for weighing, sampling, assaying and storing the U3O8 prior to sale.
6There were no spot sales in 2013.
50
7Net sales revenues and the average realized price are net of county ad valorem and state severance taxes and do not include $2,635,000 recognized from the gain on assignment of deliveries under long-term contracts because the additional revenue would distort the average realized price per pound.
8Cost of sales include all production costs (notes 2, 3 and 4) adjusted for changes in inventory values.
Cash cost per pound and non-cash cost per pound for produced and sold uranium presented in the table above are non-US GAAP measures. These measure do not have a standardized meaning or a consistent basis of calculation under US GAAP. These measures are used to assess business performance and may be used by certain investors to evaluate performance. To facilitate a better understanding of these measures, the tables below present a reconciliation of these measures to the financial results as presented in our financial statements.
|
|
|
|
|
Average Price Realized Per Pound Reconciliation |
Unit |
2013 |
|
|
|
|
|
Sales 1 |
$000 |
$ 5,663
|
|
Ad valorem and severance taxes |
$000 |
$ (682)
|
|
Net sales (a) |
$000 |
$ 4,981
|
|
|
|
|
|
Pounds sold (b) |
lb |
90,000 |
|
|
|
|
|
Average price realized per pound (a ÷ b) |
$/lb |
$ 55.34
|
Notes:
|
1 |
Does not include $2,635,000 recognized from the gain on assignment of deliveries under long-term contracts because the additional revenue would distort the average realized price per pound. |
Ad valorem and severance taxes are calculated on the average price per pound of uranium that we sell and therefore the amount of the tax will fluctuate depending on the price of uranium we receive. Because of this relationship to the price of uranium, the taxes were deducted from sales revenues in 2013 when determining the average realized price per pound sold. The 2013 average realized price per pound sold, after deducting the value-based ad valorem and severance taxes, was $55.34.
|
|
|
|
|
Cost Per Pound Sold Reconciliation |
Unit |
2013 |
|
|
|
|
|
Wellfield costs |
$000 |
$ 2,509
|
|
Plant costs |
$000 |
$ 2,352
|
|
Distribution costs |
$000 |
$ 33
|
|
Inventory change |
$000 |
($1,798) |
|
Cost of sales (a) |
$000 |
$ 3,096
|
|
|
|
|
|
Pounds sold (b) |
lb |
90,000 |
|
|
|
|
|
Cost per pound sold (a ÷ b) |
$/lb |
$ 34.40
|
While we did have a full-quarter of production costs in Q4 2013, we did not have a full quarter of uranium production. As a result, cost of goods sold ($3,096,000) included a full quarter of production costs, including $683,000 of post-construction commissioning costs. Our only uranium sales took place in the latter part of the quarter when we completed our first sales of 90,000 pounds of U3O8 in December 2013. Because of having a
51
full quarter of costs, including the post-construction commissioning costs, and only a partial quarter of uranium sales, the average cost per pound sold is somewhat elevated as compared to what we would expect to see going forward. The 2013 average cost per pound sold, including non-cash costs, was $34.40.
Year Ended December 31, 2013 Compared to Year Ended December 31, 2012
The following table summarizes the results of operations for the years ended December 31, 2013 and 2012 (in thousands of U.S. dollars):
|
|
|
|
|
|
Year ended December 31, |
|
|
|
2013 |
2012 |
|
|
$ |
$ |
|
|
|
|
|
Sales |
7,616 |
Nil |
|
Cost of sales |
(3,096) |
Nil |
|
Gross profit |
4,520 |
Nil |
|
Exploration and evaluation expense |
(2,385) | (3,285) |
|
Development expense |
(18,465) | (8,979) |
|
General and administrative expense |
(5,592) | (6,107) |
|
Accretion expense |
(27) |
- |
|
Write-off of mineral properties |
(1,430) |
- |
|
Net loss from operations |
(23,379) | (18,371) |
|
Interest income (Expense) (net) |
(6,111) | 307 |
|
Loss from equity investment |
(1,022) | (64) |
|
Foreign exchange gain (loss) |
164 | (385) |
|
Other income (loss) |
(5) | 955 |
|
Net loss |
(30,353) | (17,558) |
|
|
|
|
|
Loss per share – basic and diluted |
(0.25) | (0.15) |
|
|
|
|
|
Cost per pound sold |
34.40 |
Nil |
Sales
The Company sold a total of 90,000 pounds of U3O8 for an average price of $62.92 in 2013. Sales in 2013 were reduced by ad valorem and sales taxes of $682 thousand ($7.58 per pound) effectively reducing the price per pound to $55.34 per pound. All sales in 2013 were associated with long-term offtake contracts at rates stated within the contracts.
The Company recognized sales of $2.6 million for 2013 from deliveries under offtake agreements which had been sold to a third party during 2013 for cash consideration.
Prior to 2013, the Company had not obtained permits or begun production and sales of U3O8 and had no scheduled deliveries.
52
Cost of Sales
The cost of sales includes the wellfield, plant maintenance, site administration and conversion facility costs associated with the production of U3O8 adjusted for changes in inventory balances. There were no direct costs associated with either the recognition of the deferred revenue from the sales under the offtake contracts.
53
Operating Expenses
Total expenses for the year ended December 31, 2013 were $27.9 million which includes exploration and evaluation expense, development expense and G&A expense. These expenses increased by $8.0 million compared to 2012 due primarily to completing the first disposal wells and preparing the wellfields for production.
Exploration and evaluation expense consists of labor and associated costs of the exploration and evaluation departments as well as land holding and exploration costs including drilling and analysis on properties which have not reached the permitting or operations stage. These expenses decreased by $0.9 million for the year ended December 31, 2013 compared to 2012. Payroll and stock based compensation costs declined by $0.8 million for 2013 compared to 2012 due to the transfer of some employees to mine construction and operations on a full time basis and a reduction in stock based compensation costs. Legal fees declined by $0.1 million related to evaluation expenses not repeated in 2013. Overall expenditures have been lower in recent years as the focus has been on developing the Lost Creek property and not on exploration activities. We maintain active geological and evaluation teams, however, who focus on developing existing operations as well as new mineral opportunities.
Development expense includes costs incurred at the Lost Creek Project prior to the receipt of final regulatory approval in October 2012 and costs not directly attributable to construction and production activities, including wellfield construction and development costs. Development expenses increased by $9.5 million in 2013 compared to 2012. The most significant cost associated with in situ mining is the cost of constructing and developing the wellfield header houses, production wells, pipelines within the wellfield and to the plant and related facilities, roads, fencing, powerlines, and disposal wells. Of the cost of wellfield construction totaling $15.3 million, $12.0 million was included in development expenses in 2013 and $3.3 million was included in development expenses in 2012 as a part of the restatement of wellfield construction costs as non-capital costs, pursuant to Industry Guide 7. In addition, $1.9 million associated with the construction and completion of disposal wells was included in development expenses in 2013 and $1.2 million was included in the restatement of 2012. These costs are considered development costs despite potential future benefits as we have no proven and probable mineral reserves as defined by CIM Definition Standards and are precluded from capitalizing these expenses under SEC guidance. These costs will continue to be incurred in future years as we expand and develop new wellfields within the Lost Creek and at other projects.
G&A expense relates to administration, finance, investor relations, land and legal functions and consists principally of personnel, facility and support costs. Expenses decreased $0.5 million for the year ended December 31, 2013, respectively, compared to 2012. This is primarily due to a decrease in stock based compensation expenses of $0.7 million in 2013 compared to 2012. This was partially offset by an increase of $0.3 million in legal fees and other outside services for the year.
Write off of mineral properties increased by $1.4 million for the year 2013 as we decided to abandon claims at our South Granite Mountains project in Wyoming and private leases at the Mustang project in Nebraska.
Other Income and Expenses
We incurred interest expense in excess of interest income for the first time due to borrowing associated with the construction of the Lost Creek facility. Until the completion of construction and commencement of production, we capitalized most interest and loan amortization costs related to capitalized assets as construction costs. Interest expense includes interest on the Wyoming State Bond Loan from its inception in October until
54
year end of $0.4 million. The write off of loan fees included the cost of warrants issued as a part of the loan consideration to RMBAH totaled $5.8 million for the year 2013 was also included in interest expense.
Write off of investments increased by $1.0 million for the year ended December 31, 2013 as the management of the Bootheel Project venture allowed claims which contained no economic mineralization to lapse on the Buck Point property.
Because of the conversion of functional currency to the US$ for U.S. operations, gains and losses from foreign exchange no longer include the gains and losses associated with translating U.S. balances into Canadian dollars. As a result, these currency gains and losses on transactions are no longer significant.
In February 2012, we exchanged a database of geologic information in the Southwest Powder River Basin, Wyoming for mineral claims, state leases and related data which primarily comprises most of LC East and LC West. The fair value of the property received was $1.0 million which is reported in other income for the year ended December 31, 2012.
Loss per Common Share
Both basic and diluted loss per common share for the year ended December 31, 2013 was $0.25 compared to $0.15 in 2012. The diluted loss per common share is equal to the basic loss per common share due to the anti-dilutive effect of all convertible securities outstanding given that net losses were experienced.
Cost per pound sold
The cost per pound of U3O8 sold in 2013 was $34.40. Costs were higher than originally projected due to normal start-up considerations, lower production levels while starting up and the requirement to calculated depreciation on a straight line basis as mandated by SEC Industry Guide 7 regardless of production levels. There was no production in 2012 and therefore no cost calculations were required.
Material Changes in Financial Condition, Liquidity and Capital Resources
As of December 31, 2014, we had cash resources, consisting of cash and cash equivalents of $3.1 million, an increase of $1.5 million from the December 31, 2013 balance of $1.6 million. The cash resources consist of Canadian and U.S. dollar denominated deposit accounts, money market funds and certificates of deposit. We generated $1.9 million from operations during the year ended December 31, 2014. During the same period, we used $3.0 million for investing activities. We generated $2.7 million from financing activities for the year.
We have financed our operations from inception primarily through the issuance of equity securities and debt instruments. We did not expect to generate any cash resources from operations until we successfully completed start-up activities at the Lost Creek Project. Construction and development of the Lost Creek Project commenced in October 2012 after receiving the Record of Decision from the U.S. Department of the Interior Bureau of Land Management (“BLM”). Production activities began in August 2013 after receiving final operational clearance from the NRC. Initial deliveries and product sales commenced in December 2013 although the first collections under those sales did not occur until January 2014.
During the year, we renegotiated our borrowing with RMBAH and drew an additional $5.0 million against the loan facility. Of the additional funding, $1.5 million was from the First Loan Facility for a total of $6.5 million. The additional $3.5 million represents a line of credit component which is to be extinguished at the end of each calendar quarter, but may be immediately redrawn. The facility calls for payments of interest at at 8.5% plus
55
the three-month LIBOR rate recalculated at the start of each calendar quarter, approximately 8.755%, plus eight equal quarterly principal payments which commenced June 30, 2014. The facility matures on March 31, 2016. The RMBAH First Loan Facility is secured by all of the assets of the Pathfinder Mines Corporation.
The State Bond Loan calls for payments of interest at a fixed rate of 5.75% per annum on a quarterly basis which commenced on January 1, 2014. The principal is payable in 28 quarterly installments commencing January 1, 2015 and continuing through October 1, 2021. The State Bond Loan is secured by all of the assets at the Lost Creek Project.
Operating activities generated $1.9 million during the year ended December 31, 2014 as compared to using $27.8 million of cash resources in 2013. The change is entirely due to the completion of construction and startup of production and sales. In addition to collecting on all the sales in 2014, we collected $5.8 million from 2013 sales. Of the $29.3 million in sales, however, $2.5 million was the recognition of deferred revenue which was collected in full in 2013. We used $3.1 million to increase inventory, which consists solely of U3O8, which was offset by an increase in severance and ad valorem taxes of $1.3 million.
During 2014, the Company invested $0.4 million in equipment and $0.1 million in additional claims on existing projects. In addition, the Company increased its restricted cash by $2.5 million for cash collateral on surety bonds for reclamation work on the Lucky Mc and Shirley Basin properties.
During 2014, the Company generated $2.6 million from financing activities including $1.3 million from stock options exercises and $5.0 million from the additional borrowing described above. The Company also repaid $3.6 million on the borrowed funds.
Liquidity Outlook
Based upon our current working capital balance and the expected timing of product sales, we believe we will be able to meet current obligations without additional funding. Additional cash may be required for the construction and development of our Shirley Basin Project, but no budget or timetable has been established for that project pending the results from work currently being conducted and related permitting activities.
We expect that any major capital projects will be funded by operating cash flow, cash on hand and additional financing as required. If these cash sources are not sufficient, certain capital projects could be delayed, or alternatively we may need to pursue additional debt or equity financing and there is no assurance that such financing will be available at all or on terms acceptable to us. We have no immediate plans to issue additional securities or obtain additional funding other than that which may be required due to the uneven nature of cash flows generated from operations; however, we may issue additional debt or equity securities at any time.
Table of Contractual Obligations
The following table summarizes our contractual obligations as of December 31, 2014:
56
|
Payments due (by period) in thousands |
|||||
|
Less than |
More than |
||||
|
Total |
1 year |
1 to 3 years |
3 to 5 years |
5 years |
|
|
Notes payable |
40,567 | 7,374 | 13,302 | 10,078 | 9,813 |
|
Interest on notes payable |
7,710 | 2,372 | 2,975 | 1,791 | 572 |
|
Operating leases |
500 | 200 | 300 |
- |
- |
|
Environmental remediation |
85 | 85 |
- |
- |
- |
|
Asset retirement obligations |
24,803 |
- |
3,558 | 3,558 | 17,687 |
|
Development agreement |
199 | 199 |
- |
- |
- |
| 73,864 | 10,230 | 20,135 | 15,427 | 28,072 | |
Outstanding Share Data
As of December 31, 2014 and 2013, the Company’s capital consisted of the following:
|
December 31, 2014 |
December 31, 2013 |
Change |
|
|
Common shares |
129,365,076 | 127,559,743 | 1,805,333 |
|
Warrants |
8,374,112 | 8,374,112 |
- |
|
RSUs |
659,964 | 691,610 | (31,646) |
|
Stock options |
8,468,614 | 9,273,659 | (805,045) |
|
Fully diluted shares outstanding |
146,867,766 | 145,899,124 | 968,642 |
Off Balance Sheet Arrangements
We have not entered into any material off-balance sheet arrangements such as guaranteed contracts, contingent interests in assets transferred to unconsolidated entities, derivative instrument obligations, or with respect to any obligations under a variable interest entity arrangement.
Financial Instruments and Other Instruments
The Company’s cash and cash equivalents are composed of:
|
As of December 31, |
As of December 31, |
||
|
2014 |
2013 |
||
|
$ |
$ |
||
|
Cash on deposit at banks |
431 | 296 | |
|
Money market funds |
2,673 | 1,331 | |
| 3,104 | 1,627 |
57
Quarterly financial data (unaudited)
|
2014 |
||||
|
Quarter ended |
||||
|
Dec. 31 |
Sep. 30 |
Jun. 30 |
Mar. 31 |
|
|
Revenue |
6,637 | 7,329 | 9,236 | 6,147 |
|
Net loss for the period |
(2,497) | (3,500) | (804) | (1,948) |
|
Loss per share – basic and diluted |
(0.02) | (0.03) | (0.01) | (0.02) |
|
2013 |
||||
|
Quarter ended |
||||
|
Dec. 31 |
Sep. 30 |
Jun. 30 |
Mar. 31 |
|
|
Revenue |
7,616 |
- |
- |
- |
|
Net loss for the period |
(6,161) | (7,336) | (9,661) | (7,195) |
|
Loss per share – basic and diluted |
(0.05) | (0.06) | (0.08) | (0.06) |
Credit risk
Financial instruments that potentially subject us to concentrations of credit risk consist of cash and cash equivalents, deposits and restricted cash, which together totaled approximately $10.7 million at December 31, 2014. These assets include Canadian dollar and U.S. dollar denominated certificates of deposit, money market accounts and demand deposits. They bear interest at annual rates ranging from 0.18% to 0.40% and mature at various dates up to February 2, 2016. These instruments are maintained at financial institutions in Canada and the United States. Of the amount held on deposit, approximately $0.9 million is covered by the Canada Deposit Insurance Corporation, the Securities Investor Protection Corporation or the United States Federal Deposit Insurance Corporation which leaves approximately $9.8 million at risk at December 31, 2014 should the financial institutions with which these amounts are invested be rendered insolvent. We do not consider any of our financial assets to be impaired as of December 31, 2014.
Liquidity risk
Liquidity risk is the risk that we will not be able to meet our financial obligations as they come due.
As at December 31, 2014, our financial liabilities consisted of trade accounts payable and accrued trade and payroll liabilities of $3.0 million which are due within normal trade terms of generally 30 to 60 days, notes payable which will be payable over periods 0 to 7 years and asset retirement obligations with estimated completion dates until 2033.
58
Item 7A. Quantitative AND QUALITATIVE DISCLOSURES ABOUT MARKET RISK
Market risk
Market risk is the risk to the Company of adverse financial impact due to changes in the fair value or future cash flows of financial instruments as a result of fluctuations in interest rates and foreign currency exchange rates. As the US$ is now the functional currency of our U.S. operations, the currency risk has been significantly reduced.
Interest rate risk
Financial instruments that expose the Company to interest rate risk are its cash equivalents, deposits, restricted cash and debt financings. Our objectives for managing our cash and cash equivalents are to maintain sufficient funds on hand at all times to meet day to day requirements and to place any amounts which are considered in excess of day to day requirements on short-term deposit with the Company's financial institutions so that they earn interest.
Currency risk
We maintain a balance of less than $0.1 million in foreign currency resulting in a low currency risk.
Commodity Price Risk
The Company is subject to market risk related to the market price of uranium. We have nine uranium supply contracts with pricing fixed or based on inflation factors applied to a fixed base. Additional future sales would be impacted by both spot and long-term uranium price fluctuations. Historically, uranium prices have been subject to fluctuation, and the price of uranium has been and will continue to be affected by numerous factors beyond our control, including the demand for nuclear power, political and economic conditions, and governmental legislation in uranium producing and consuming countries and production levels and costs of production of other producing companies. The spot market price for uranium has demonstrated a large range since January 2001. Prices have risen from $7.10 per pound at January 2001 to a high of $136.00 per pound as of June 2007. The spot market price was $38.38 per pound as of March 2, 2014.
Transactions with Related Parties
During the fiscal years ended December 31, 2014 and 2013, we did not participate in any material transactions with related parties.
Proposed Transactions
As is typical of the mineral exploration and development industry, we will consider and review potential merger, acquisition, investment and venture transactions and opportunities that could enhance shareholder value. Timely disclosure of such transactions is made as soon as reportable events arise.
Recent Accounting Pronouncements Adopted in the Year Ended December 31, 2014
We continue to monitor new accounting pronouncements and their applicability to our operations and reporting. During 2014, there were no new pronouncements which directly affected our accounting policies or reporting.
59
Recent Accounting Pronouncements Not Yet Adopted
In May 2014, the FASB issued ASU 2014-09, Revenue from Contracts with Customers. Under ASU 2014-09, an entity will recognize revenue when it transfers promised goods or services to customers in an amount that reflects what it expects in exchange for the goods or services. It also requires more detailed disclosures to enable users of financial statements to understand the nature, amount, timing, and uncertainty of revenue and cash flows arising from contracts with customers. This guidance is effective for annual periods beginning on or after December 15, 2016. The adoption of this standard is not expected to have a material impact on the financial statements of the Company
Critical Accounting Policies and Estimates
We have established the existence of mineral resources at the Lost Creek Project, but because of the unique nature of in situ recovery mines, we have not established, and have no plans to establish the existence of proven and probable reserves at this project.
Mineral Properties
Acquisition costs of mineral properties are capitalized. When production is attained at a property, these costs will be amortized over a period of estimated benefit.
As of December 31, 2014, the current and long term price of uranium was $35.50 and $49.50, respectively. This compares to prices of $35.00 and $50.50 as of December 31, 2013. Other than as discussed earlier, management did not identify any impairment indicators for any of the Company’s mineral properties during the twelve months ended December 31, 2014.
Development costs including, but not limited to, production wells, header houses, piping and power will be expensed as incurred as we have no proven and probable reserves.
Depreciation
The depreciable life of the Lost Creek plant, equipment and enclosure was determined to be the nameplate life of the equipment housed in the processing plant as plans exist for other uses for the equipment beyond the estimated production at the Lost Creek Project.
Inventory and Cost of Sales
Our inventories are measured at the lower of cost and net realizable value based on projected revenues from the sale of that product. We are allocating all costs of operations of the Lost Creek facility to the inventory valuation at various stages of production with the exception of wellfield and disposal well costs which are treated as development expenses when incurred. Depreciation of facility enclosures, equipment and asset retirement obligations as well as amortization of the acquisition cost of the related property is also included in the inventory valuation. We do not allocate any administrative or other overhead to the cost of the product.
Because of the nature of in situ operations, it is not economically feasible to accurately measure the amount of in-process inventory at any given time. We use a combination of calculating estimated uranium captured per sampling applied to total water processing flow to determine the estimated pounds captured.
60
Share-Based Compensation
We are required to initially record all equity instruments including warrants, restricted share units and stock options at fair value in the financial statements.
Management utilizes the Black-Scholes model to calculate the fair value of the warrants and stock options at the time they are issued. Use of the Black-Scholes model requires management to make estimates regarding the expected volatility of the Company’s stock over the future life of the equity instrument, the estimate of the expected life of the equity instrument and the number of options that are expected to be forfeited. Determination of these estimates requires significant judgment and requires management to formulate estimates of future events based on a limited history of actual results.
Item 8. FINANCIAL STATEMENTS AND SUPPLEMENTARY DATA
See “Index to Consolidated Financial Statements” following the signature page of this Form 10-K.
Item 9. CHANGES IN AND DISAGREEMENTS WITH ACCOUNTANTS ON ACCOUNTING AND FINANCIAL DISCLOSURE
None.
Item 9A. Controls and Procedures
|
(a) |
Evaluation of Disclosure Controls and Procedures |
As of the fiscal year ended December 31, 2014, under the supervision of the Chief Executive Officer and the Chief Financial Officer, the Company evaluated the effectiveness of its disclosure controls and procedures, as such term is defined in Rule 13a-15(e) and Rule 15d-15(e) under the Securities Exchange Act of 1934 (the “Exchange Act”). Based on this evaluation, the Chief Executive Officer and the Chief Financial Officer have concluded that the Company’s disclosure controls and procedures are effective to ensure that information the Company is required to disclose in reports that are filed or submitted under the Exchange Act: (1) is recorded, processed and summarized effectively and reported within the time periods specified in SEC rules and forms, and (2) is accumulated and communicated to Company management, including the Chief Executive Officer and the Chief Financial Officer, as appropriate to allow timely decisions regarding required disclosure. The Company’s disclosure controls and procedures include components of internal control over financial reporting. No matter how well designed and operated, internal controls over financial reporting can provide only reasonable, but not absolute, assurance that the control system's objectives will be met.
(b)Management’s Report on Internal Control over Financial Reporting
Pursuant to Section 404 of the Sarbanes-Oxley Act of 2002, the Company’s management is responsible for establishing and maintaining adequate internal control over financial reporting, as such term is defined in Exchange Act Rules 13a-15(f) and 15d-15(f). The Company’s internal control over financial reporting is a process designed to provide reasonable assurance regarding the reliability of financial reporting and the preparation of financial statements for external purposes in accordance with US GAAP.
All internal control systems, no matter how well designed, have inherent limitations. Therefore, even those systems determined to be effective can provide only reasonable assurance with respect to financial statement
61
preparation and presentation. Because of the inherent limitations, internal control over financial reporting may not prevent or detect misstatements. Projections of any evaluation of effectiveness to future periods are subject to the risk that controls may become inadequate because of changes in conditions, or that the degree of compliance with the policies or procedures may deteriorate.
As of December 31, 2014, management conducted an assessment of the effectiveness of the Company's internal control over financial reporting based on the criteria established in Internal Control-Integrated Framework (1992) issued by the Committee of Sponsoring Organizations of the Treadway Commission (COSO). Based on its assessment using those criteria, management concluded that the Company maintained effective internal control over financial reporting as of December 31, 2014. The effectiveness of the Company’s internal control over financial reporting at December 31, 2014, has been audited by PricewaterhouseCoopers LLP, as stated in their report.
(c)Attestation Report of Registered Public Accounting Firm
PricewaterhouseCoopers LLP’s attestation report on our internal control over financial reporting is included as part of Item 8. Financial Statements and Supplementary Data herein.
(d)Changes in Internal Controls over Financial Reporting
No changes in our internal control over financial reporting occurred during the year ended December 31, 2014 that have materially affected, or are reasonably likely to materially affect, our internal control over financial reporting.
None.
62
Item 10. DIRECTORS, EXECUTIVE OFFICERS AND CORPORATE GOVERNANCE
Information relating to this item will be included in an amendment to this report or in the proxy statement for our 2015 Annual Meeting of Shareholders and is incorporated by reference in this report.
Code of Ethics
We have adopted a Code of Ethics (“Code”) which applies to all employees, officers and directors. The full text of the Code is available on our website at Error! Hyperlink reference not valid.We will post any amendments to, or waivers from, the Code on our corporate website or by filing a Current Report on Form 8-K.
Item 11. EXECUTIVE COMPENSATION
Information relating to this item will be included in an amendment to this report or in the proxy statement for our 2015 Annual Meeting of Shareholders and is incorporated by reference in this report.
Item 12. SECURITY OWNERSHIP OF Certain BENEFICIAL OWNERS
AND MANAGEMENT AND RELATED STOCKHOLDER MATTERS
Information relating to this item will be included in an amendment to this report or in the proxy statement for our 2015 Annual Meeting of Shareholders and is incorporated by reference in this report.
Item 13. CERTAIN RELATIONSHIPS AND RELATED TRANSACTIONS,
AND DIRECTOR INDEPENDENCE
Information relating to this item will be included in an amendment to this report or in the proxy statement for our 2015 Annual Meeting of Shareholders and is incorporated by reference in this report.
Item 14. PRINCIPAL ACCOUNTing FEES AND SERVICES
Information relating to this item will be included in an amendment to this report or in the proxy statement for our 2015 Annual Meeting of Shareholders and is incorporated by reference in this report.
63
Item 15. Exhibits, Financial statement schedules
Financial Statements and Financial Statement Schedules
See “Index to Consolidated financial statements” on page F-1.
|
|
|
|
|
Incorporated by Reference |
|
|
||||
|
Exhibit Number |
|
Exhibit Description |
|
Form |
|
Date of Report |
|
Exhibit |
|
Filed Herewith |
|
3.1 |
|
Articles of Continuance and Articles of Amendment |
|
S-3 |
|
1/10/2014 |
|
3.1 |
|
|
|
|
|
|
|
|
|
|
|
|
|
|
|
3.2 |
|
Amended By-Law No. 1 |
|
S-3 |
|
1/10/2014 |
|
3.2 |
|
|
|
|
|
|
|
|
|
|
|
|
|
|
|
3.3 |
|
By-Law No. 2 (Advance Notice) |
|
8-K |
|
2/06/2015 |
|
3.1 |
|
|
|
|
|
|
|
|
|
|
|
|
|
|
|
4.1 |
|
Form of Warrant dated December 19, 2013 |
|
6-K |
|
12/19/2013 |
|
99.1 |
|
|
|
|
|
|
|
|
|
|
|
|
|
|
|
10.1 |
|
Facility Agreement (RMB Australia Holdings Ltd) |
|
6-K |
|
7/03/2013 |
|
|
|
|
|
|
|
|
|
|
|
|
|
|
|
|
|
10.2 |
|
Second Facility Agreement (RMB Australia Holdings Ltd) |
|
6-K |
|
9/03/2013 |
|
|
|
|
|
|
|
|
|
|
|
|
|
|
|
|
|
10.3 |
|
Amendment and Restatement Agreement – Facility Agreement (RMB Australia Holdings Ltd) |
|
6-K |
|
9/03/2013 |
|
|
|
|
|
|
|
|
|
|
|
|
|
|
|
|
|
10.4 |
|
Financing Agreement and Mortgage (State of Wyoming Industrial Revenue Bond Loan) |
|
6-K |
|
10/29/2013 |
|
99.1 |
|
|
|
|
|
|
|
|
|
|
|
|
|
|
|
10.5 |
|
Second Amendment and Restatement Agreement – Facility Agreement (RMB Australia Holdings Ltd) |
|
8-K |
|
03/19/2014 |
|
10.1 |
|
|
|
|
|
|
|
|
|
|
|
|
|
|
|
10.7 |
|
Share Purchase Agreement and Registration Rights Agreement (Private Placement) |
|
6-K |
|
12/19/2013 |
|
|
|
|
|
|
|
|
|
|
|
|
|
|
|
|
|
10.8 |
|
Amended Share Purchase Agreement (Pathfinder Mines Corporation) |
|
6-K |
|
12/23/2013 |
|
10.1 |
|
|
|
|
|
|
|
|
|
|
|
|
|
|
|
10.8 |
|
Employment Agreement with Jeffrey T. Klenda, as amended |
|
10-K |
|
3/3/2014 |
|
10.7 |
|
|
|
|
|
|
|
|
|
|
|
|
|
|
64
|
10.9 |
|
Employment Agreement with Wayne W. Heili, as amended |
|
10-K |
|
3/3/2014 |
|
10.8 |
|
|
|
|
|
|
|
|
|
|
|
|
|
|
|
10.10 |
|
Employment Agreement with Roger L. Smith, as amended |
|
10-K |
|
3/3/2014 |
|
10.9 |
|
|
|
|
|
|
|
|
|
|
|
|
|
|
|
10.11 |
|
Employment Agreement with Steven M. Hatten, as amended |
|
10-K |
|
3/3/2014 |
|
10.10 |
|
|
|
|
|
|
|
|
|
|
|
|
|
|
|
10.12 |
|
Employment Agreement with John W. Cash, as amended |
|
10-K |
|
3/3/2014 |
|
10.11 |
|
|
|
|
|
|
|
|
|
|
|
|
|
|
|
10.13 |
|
Employment Agreement with Penne A. Goplerud, as amended |
|
10-K |
|
3/3/2014 |
|
10.12 |
|
|
|
|
|
|
|
|
|
|
|
|
|
|
|
10.14 |
|
Employment Agreement with James A. Bonner |
|
|
|
|
|
|
|
X |
|
|
|
|
|
|
|
|
|
|
|
|
|
10.15 |
|
Ur-Energy Inc. Amended and Restated Stock Option Plan |
|
S-8 |
|
5/14/2012 |
|
4.1 |
|
|
|
|
|
|
|
|
|
|
|
|
|
|
|
10.16 |
|
Amended Restricted Share Unit Plan |
|
S-8 |
|
5/14/2012 |
|
4.2 |
|
|
|
|
|
|
|
|
|
|
|
|
|
|
|
14.1 |
|
Code of Ethics for CEO, CFO and Senior Financial Officers |
|
8-K |
|
2/11/2014 |
|
14.1 |
|
|
|
|
|
|
|
|
|
|
|
|
|
|
|
21.1 |
|
Subsidiaries of the Registrant |
|
10-K |
|
3/3/2014 |
|
|
|
|
|
|
|
|
|
|
|
|
|
|
|
|
|
23.1 |
|
Consent of PricewaterhouseCoopers LLP |
|
|
|
|
|
|
|
X |
|
|
|
|
|
|
|
|
|
|
|
|
|
23.2 |
|
Consent of TREC, Inc. |
|
|
|
|
|
|
|
X |
|
|
|
|
|
|
|
|
|
|
|
|
|
23.3 |
|
Consent of WWC Engineering |
|
|
|
|
|
|
|
X |
|
|
|
|
|
|
|
|
|
|
|
|
|
31.1 |
|
Certification of CEO Pursuant to Exchange Act Rules 13a-14 and 15d-14, as adopted pursuant to Section 302 of the Sarbanes-Oxley Act of 2002. |
|
|
|
|
|
|
|
X |
|
|
|
|
|
|
|
|
|
|
|
|
|
31.2 |
|
Certification of CFO Pursuant to Exchange Act Rules 13a-14 and 15d-14, as adopted pursuant to Section 302 of the Sarbanes-Oxley Act of 2002. |
|
|
|
|
|
|
|
X |
|
|
|
|
|
|
|
|
|
|
|
|
|
32.1 |
|
Certification of CEO Pursuant to 18 U.S.C. Section 1350, as adopted pursuant to Section 906 of the Sarbanes-Oxley Act of 2002. |
|
|
|
|
|
|
|
X |
|
|
|
|
|
|
|
|
|
|
|
|
65
|
32.2 |
|
Certification of CFO Pursuant to 18 U.S.C. Section 1350, as adopted pursuant to Section 906 of the Sarbanes-Oxley Act of 2002. |
|
|
|
|
|
|
|
X |
|
|
|
|
|
|
|
|
|
|
|
|
|
101.INS |
|
XBRL Instance Document |
|
|
|
|
|
|
|
X |
|
|
|
|
|
|
|
|
|
|
|
|
|
101.SCH |
|
XBRL Schema Document |
|
|
|
|
|
|
|
X |
|
|
|
|
|
|
|
|
|
|
|
|
|
101.CAL |
|
XBRL Calculation Linkbase Document |
|
|
|
|
|
|
|
X |
|
|
|
|
|
|
|
|
|
|
|
|
|
101.DEF |
|
XBRL Definition Linkbase Document |
|
|
|
|
|
|
|
X |
|
|
|
|
|
|
|
|
|
|
|
|
|
101.LAB |
|
XBRL Labels Linkbase Document |
|
|
|
|
|
|
|
X |
|
|
|
|
|
|
|
|
|
|
|
|
|
101.PRE |
|
XBRL Presentation Linkbase Document |
|
|
|
|
|
|
|
X |
|
|
|
|
|
|
|
|
|
|
|
|
|
99.1 |
|
Location maps (1) |
|
10-K |
|
3/3/2014 |
|
|
|
|
|
|
|
|
|
|
|
|
|
|
|
|
|
(1) |
Filed herewith under Items 1 and 2. Business and Properties. |
66
Pursuant to the requirements of Section 13 or 15(d) of the Securities Exchange Act of 1934, the registrant has duly caused this report to be signed on its behalf by the undersigned, thereunto duly authorized.
|
|
|
UR-ENERGY INC. |
|
|
|
|
|
Date: March 2, 2015 |
By: |
/s/ Wayne W. Heili |
|
|
|
Wayne W. Heili |
|
|
|
President and Chief Executive Officer |
Pursuant to the requirements of the Securities Exchange Act of 1934, this report has been signed by the following persons on behalf of the registrant and in the capacities and on the dates indicated.
|
Date: March 2, 2015 |
By: |
/s/ Wayne W. Heili |
|
|
|
Wayne W. Heili |
|
|
|
President and Chief Executive Officer (Principal Executive Officer) and Director |
|
|
|
|
|
Date: March 2 , 2015 |
By: |
/s/Roger L. Smith |
|
|
|
Roger L. Smith |
|
|
|
Chief Financial Officer (Principal Financial Officer and Principal Accounting Officer) |
|
|
|
|
|
Date: March 2, 2015 |
By: |
/s/ Jeffrey T. Klenda |
|
|
|
Jeffrey T. Klenda |
|
|
|
Chairman and Executive Director |
|
|
|
|
|
Date: March 2, 2015 |
By: |
/s/ W. William Boberg |
|
|
|
W. William Boberg |
|
|
|
Director |
|
|
|
|
|
Date: March 2, 2015 |
By: |
/s/ James M. Franklin |
|
|
|
James M. Franklin |
|
|
|
Director |
|
|
|
|
|
Date: March 2, 2015 |
By: |
/s/ Paul Macdonell |
|
|
|
Paul Macdonell |
|
|
|
Director |
|
|
|
|
|
Date: March 2, 2015 |
By: |
/s/ Thomas Parker |
|
|
|
Thomas Parker |
|
|
|
Director |
67
Ur-Energy Inc.
Headquartered in Littleton, Colorado
Consolidated Financial Statements
December 31, 2014
(expressed in thousands of U.S. dollars unless otherwise indicated)
68

March 2, 2015
Independent Auditor’s Report
To the Shareholders of Ur-Energy Inc.
We have completed integrated audits of Ur-Energy Inc.’s December 31, 2014, 2013 and 2012 consolidated financial statements and its internal control over financial reporting as at December 31, 2014. Our opinions, based on our audits, are presented below.
Report on the consolidated financial statements
We have audited the accompanying consolidated financial statements of Ur-Energy Inc., which comprise the consolidated balance sheets as at December 31, 2014 and December 31, 2013 and the consolidated statements of operations and comprehensive loss, shareholders’ equity and cash flow for each of the years in the three year period ended December 31, 2014, and the related notes, which comprise a summary of significant accounting policies and other explanatory information.
Management’s responsibility for the consolidated financial statements
Management is responsible for the preparation and fair presentation of these consolidated financial statements in accordance with accounting principles generally accepted in the United States of America and for such internal control as management determines is necessary to enable the preparation of consolidated financial statements that are free from material misstatement, whether due to fraud or error.
Auditor’s responsibility
Our responsibility is to express an opinion on these consolidated financial statements based on our audits. We conducted our audits in accordance with Canadian generally accepted auditing standards and the standards of the Public Company Accounting Oversight Board (United States). Those standards require that we plan and perform the audit to obtain reasonable assurance about whether the consolidated financial statements are free from material misstatement. Canadian generally accepted auditing standards also require that we comply with ethical requirements.
An audit involves performing procedures to obtain audit evidence, on a test basis, about the amounts and disclosures in the consolidated financial statements. The procedures selected depend on the auditor’s judgment, including the assessment of the risks of material misstatement of the consolidated financial statements, whether due to fraud or error. In making those risk assessments, the auditor considers internal control relevant to the company’s preparation and fair presentation of the consolidated financial statements in order to design audit procedures that are appropriate in the circumstances. An audit also includes evaluating the appropriateness of accounting principles and policies used and the reasonableness
of accounting estimates made by management, as well as evaluating the overall presentation of the consolidated financial statements.
We believe that the audit evidence we have obtained in our audits is sufficient and appropriate to provide a basis for our audit opinion on the consolidated financial statements.
69
Opinion
In our opinion, the consolidated financial statements present fairly, in all material respects, the financial position of Ur-Energy Inc. as at December 31, 2014 and December 31, 2013 and 2012 and its financial performance and cash flows for each of the three years in the period ended December 31, 2014 in accordance with accounting principles generally accepted in the United States of America.
Report on internal control over financial reporting
We have also audited Ur-Energy Inc.’s internal control over financial reporting as at December 31, 2014, based on criteria established in Internal Control - Integrated Framework (2013) issued by the Committee of Sponsoring Organizations of the Treadway Commission (COSO).
Management’s responsibility for internal control over financial reporting
Management is responsible for maintaining effective internal control over financial reporting and for its assessment of the effectiveness of internal control over financial reporting, included in Management’s Report on Internal Control over Financial Reporting.
Auditor’s responsibility
Our responsibility is to express an opinion on the company’s internal control over financial reporting based on our audit. We conducted our audit of internal control over financial reporting in accordance with the standards of the Public Company Accounting Oversight Board (United States). Those standards require that we plan and perform the audit to obtain reasonable assurance about whether effective internal control over financial reporting was maintained in all material respects.
An audit of internal control over financial reporting includes obtaining an understanding of internal control over financial reporting, assessing the risk that a material weakness exists, testing and evaluating the design and operating effectiveness of internal control based on the assessed risk, and performing such other procedures as we consider necessary in the circumstances.
We believe that our audit provides a reasonable basis for our audit opinion on the company’s internal control over financial reporting.
Definition of internal control over financial reporting
A company’s internal control over financial reporting is a process designed to provide reasonable assurance regarding the reliability of financial reporting and the preparation of financial statements for external purposes in accordance with generally accepted accounting principles. A company’s internal control over financial reporting includes those policies and procedures that: (i) pertain to the maintenance of records that, in reasonable detail, accurately and fairly reflect the transactions and dispositions of the assets of the company; (ii) provide reasonable assurance that transactions are recorded as necessary to permit preparation of financial statements in accordance with generally accepted accounting principles, and that receipts and expenditures of the company are being made only in accordance with authorizations of management and directors of the company; and (iii) provide reasonable assurance regarding prevention or timely detection of unauthorized acquisition, use, or disposition of the company’s assets that could have a material effect on the financial statements.
Inherent limitations
Because of its inherent limitations, internal control over financial reporting may not prevent or detect misstatements. Also, projections of any evaluation of effectiveness to future periods are subject to the risk that controls may become inadequate because of changes in conditions or that the degree of compliance with the policies or procedures may deteriorate.
70
Opinion
In our opinion, Ur-Energy Inc. maintained, in all material respects, effective internal control over financial reporting as at December 31, 2014, based on criteria established in Internal Control - Integrated Framework (2013) issued by COSO.
/s/ PricewaterhouseCoopers LLP
Chartered Accountants
Vancouver, BC
Canada
71
Ur-Energy Inc.
Consolidated Balance Sheet
(expressed in thousands of U.S. dollars)
|
|
|
|
|
|
|
December 31, |
|
December 31, |
|
|
2014 |
|
2013 |
|
Assets |
|
|
|
|
Current assets |
|
|
|
|
Cash and cash equivalents (note 4) |
3,104 |
|
1,627 |
|
Accounts receivable (note 5) |
28 |
|
5,802 |
|
Inventory (note 6) |
5,168 |
|
2,053 |
|
Current deferred financing costs (note 12) |
190 |
|
183 |
|
Prepaid expenses |
856 |
|
767 |
|
|
9,346 |
|
10,432 |
|
|
|
|
|
|
Restricted cash (note 7) |
7,556 |
|
5,055 |
|
Mineral properties (note 8) |
52,750 |
|
52,702 |
|
Capital assets (note 9) |
32,993 |
|
35,250 |
|
Equity investment (note 10) |
1,090 |
|
1,085 |
|
Deferred financing costs (note 12) |
716 |
|
812 |
|
|
95,105 |
|
94,904 |
|
|
104,451 |
|
105,336 |
|
Liabilities and shareholders' equity |
|
|
|
|
Current liabilities |
|
|
|
|
Accounts payable and accrued liabilities (note 11) |
4,532 |
|
2,928 |
|
Current portion of notes payable (note 12) |
7,374 |
|
5,153 |
|
Deferred revenue (note 13) |
- |
|
2,508 |
|
Reclamation obligations |
85 |
|
85 |
|
|
11,991 |
|
10,674 |
|
Notes payable (note 12) |
33,193 |
|
34,000 |
|
Deferred income tax liability (note 14) |
3,345 |
|
3,345 |
|
Asset retirement obligations (note 15) |
23,445 |
|
17,279 |
|
Other liabilities - warrants (note 16) |
376 |
|
1,374 |
|
|
60,359 |
|
55,998 |
|
|
72,350 |
|
66,672 |
|
Commitments (note 21) |
|
|
|
|
Shareholders' equity (note 17) |
|
|
|
|
Share Capital |
|
|
|
|
Class A preferred shares, without par value, unlimited shares authorized; no shares issued and outstanding |
- |
|
- |
|
Common shares, without par value, unlimited shares authorized; shares issued and outstanding: 129,365,076 at December 31, 2014 and 127,559,743 at December 31, 2013 |
168,118 |
|
165,974 |
|
Warrants |
4,175 |
|
4,175 |
|
Contributed surplus |
14,250 |
|
14,247 |
|
Accumulated other comprehensive income |
3,337 |
|
3,298 |
|
Deficit |
(157,779) |
|
(149,030) |
|
|
32,101 |
|
38,664 |
|
|
104,451 |
|
105,336 |
The accompanying notes are an integral part of these consolidated financial statements
Approved by the Board of Directors
|
/s/ Jeffrey T. Klenda, Chairman |
|
/s/ Thomas Parker, Director |
72
Ur-Energy Inc.
Consolidated Statements of Operations and Comprehensive Loss
(expressed in thousands of U.S. dollars except for share data)
|
|
|
|
|
|
|
|
|
Year ended December 31, |
||||
|
|
2014 |
|
2013 |
|
2012 |
|
|
|
|
|
|
|
|
Sales (note 18) |
29,349 |
|
7,616 |
|
- |
|
|
|
|
|
|
|
|
Cost of sales |
(17,858) |
|
(3,096) |
|
- |
|
|
|
|
|
|
|
|
Gross profit |
11,491 |
|
4,520 |
|
- |
|
|
|
|
|
|
|
|
Operating Expenses |
|
|
|
|
|
|
|
|
|
|
|
|
|
Exploration and evaluation |
(3,277) |
|
(2,385) |
|
(3,285) |
|
Development |
(7,672) |
|
(18,465) |
|
(8,979) |
|
General and administrative |
(6,541) |
|
(5,592) |
|
(6,107) |
|
Accretion |
(497) |
|
(27) |
|
- |
|
Write-off of mineral properties (note 8) |
(483) |
|
(1,430) |
|
- |
|
|
|
|
|
|
|
|
Loss from operations |
(6,979) |
|
(23,379) |
|
(18,371) |
|
|
|
|
|
|
|
|
Interest income (expense) (net) |
(2,699) |
|
(6,111) |
|
307 |
|
Warrant mark to market adjustment (note 16) |
946 |
|
- |
|
|
|
Loss on equity investment (note 10) |
(5) |
|
(1,022) |
|
(64) |
|
Foreign exchange gain ( loss) |
(12) |
|
164 |
|
(385) |
|
Other loss |
- |
|
(5) |
|
955 |
|
|
|
|
|
|
|
|
Net loss for the year |
(8,749) |
|
(30,353) |
|
(17,558) |
|
|
|
|
|
|
|
|
Loss per common share |
|
|
|
|
|
|
Basic and diluted |
(0.07) |
|
(0.25) |
|
(0.15) |
|
|
|
|
|
|
|
|
Weighted average number of common shares outstanding |
|
|
|
|
|
|
Basic and diluted |
128,781,215 |
|
122,231,993 |
|
118,521,509 |
|
|
|
|
|
|
|
|
COMPREHENSIVE LOSS |
|
|
|
|
|
|
Net loss for the year |
(8,749) |
|
(30,353) |
|
(17,558) |
|
Other Comprehensive loss, net of tax |
|
|
|
|
|
|
Translation adjustment as of date of adoption of US$ as functional currency |
- |
|
(6,161) |
|
- |
|
Translation adjustment on foreign operations |
39 |
|
(210) |
|
1,445 |
|
|
|
|
|
|
|
|
Comprehensive loss for the year |
(8,710) |
|
(36,724) |
|
(16,113) |
The accompanying notes are an integral part of these consolidated financial statements
73
Ur-Energy Inc.
Consolidated Statements of Shareholders’ Equity
(expressed in thousands of U.S. dollars except for share data)
|
|
|
|
|
|
|
|
|
|
|
|
|
|
|
|
|
|
|
|
|
|
|
|
|
Accumulated |
|
|
|
|
|
|
|
|
|
|
|
|
|
|
Other |
|
|
|
|
|
|
Capital Stock |
|
|
|
Contributed |
|
Comprehensive |
|
|
|
Shareholders' |
||
|
|
Shares |
|
Amount |
|
Warrants |
|
Surplus |
|
Income |
|
Deficit |
|
Equity |
|
|
|
|
|
|
|
|
|
|
|
|
|
|
|
|
|
# |
|
$ |
|
$ |
|
$ |
|
$ |
|
$ |
|
$ |
|
|
|
|
|
|
|
|
|
|
|
|
|
|
|
|
Balance, December 31, 2011 |
103,675,444 |
|
144,156 |
|
43 |
|
11,685 |
|
8,224 |
|
(101,119) |
|
62,989 |
|
|
|
|
|
|
|
|
|
|
|
|
|
|
|
|
Exercise of stock options |
88,473 |
|
117 |
|
- |
|
(41) |
|
- |
|
- |
|
76 |
|
Common shares issued for cash, net |
|
|
|
|
|
|
|
|
|
|
|
|
|
|
of issue costs |
17,250,000 |
|
16,275 |
|
- |
|
- |
|
- |
|
- |
|
16,275 |
|
Redemption of vested RSUs |
120,359 |
|
348 |
|
- |
|
(366) |
|
- |
|
- |
|
(18) |
|
Issuance of warrants |
- |
|
- |
|
18 |
|
- |
|
- |
|
- |
|
18 |
|
Non-cash stock compensation |
- |
|
- |
|
- |
|
2,410 |
|
- |
|
- |
|
2,410 |
|
Net loss and comprehensive loss |
- |
|
- |
|
- |
|
- |
|
1,445 |
|
(17,558) |
|
(16,113) |
|
|
|
|
|
|
|
|
|
|
|
|
|
|
|
|
Balance, December 31, 2012 |
121,134,276 |
|
160,896 |
|
61 |
|
13,688 |
|
9,669 |
|
(118,677) |
|
65,637 |
|
|
|
|
|
|
|
|
|
|
|
|
|
|
|
|
Exercise of stock options |
377,927 |
|
420 |
|
- |
|
(145) |
|
- |
|
- |
|
275 |
|
Common shares issued for cash, net |
|
|
|
|
|
|
|
|
|
|
|
|
|
|
of issue costs |
4,709,089 |
|
3,396 |
|
- |
|
- |
|
- |
|
- |
|
3,396 |
|
Adjustment to beginning balances due to change in functional currency |
- |
|
- |
|
- |
|
- |
|
(6,161) |
|
- |
|
(6,161) |
|
Redemption of vested RSUs |
338,451 |
|
499 |
|
- |
|
(563) |
|
- |
|
- |
|
(64) |
|
Issuance of warrants |
- |
|
- |
|
4,228 |
|
- |
|
- |
|
- |
|
4,228 |
|
Cancellation of warrants |
- |
|
- |
|
(114) |
|
114 |
|
- |
|
- |
|
- |
|
Common shares issued for royalty interest |
1,000,000 |
|
763 |
|
- |
|
- |
|
- |
|
- |
|
763 |
|
Non-cash stock compensation |
- |
|
- |
|
- |
|
1,153 |
|
- |
|
- |
|
1,153 |
|
Net loss and comprehensive loss |
- |
|
- |
|
- |
|
- |
|
(210) |
|
(30,353) |
|
(30,563) |
|
|
|
|
|
|
|
|
|
|
|
|
|
|
|
|
Balance, December 31, 2013 |
127,559,743 |
|
165,974 |
|
4,175 |
|
14,247 |
|
3,298 |
|
(149,030) |
|
38,664 |
|
|
|
|
|
|
|
|
|
|
|
|
|
|
|
|
Exercise of stock options |
1,623,139 |
|
2,052 |
|
- |
|
(705) |
|
- |
|
- |
|
1,347 |
|
Common shares issued for cash, net |
|
|
|
|
|
|
|
|
|
|
|
|
|
|
of issue costs - additional costs |
- |
|
(50) |
|
- |
|
- |
|
- |
|
- |
|
(50) |
|
Redemption of vested RSUs |
182,194 |
|
142 |
|
- |
|
(225) |
|
- |
|
- |
|
(83) |
|
Other capital contributions |
- |
|
- |
|
- |
|
5 |
|
- |
|
- |
|
5 |
|
Non-cash stock compensation |
- |
|
- |
|
- |
|
928 |
|
- |
|
- |
|
928 |
|
Net loss and comprehensive income |
- |
|
- |
|
- |
|
- |
|
39 |
|
(8,749) |
|
(8,710) |
|
|
|
|
|
|
|
|
|
|
|
|
|
|
|
|
Balance, December 31, 2014 |
129,365,076 |
|
168,118 |
|
4,175 |
|
14,250 |
|
3,337 |
|
(157,779) |
|
32,101 |
The accompanying notes are an integral part of these consolidated financial statements
74
Ur-Energy Inc.
Consolidated Statements of Cash Flow
(expressed in thousands of U.S. dollars)
|
|
|
|
|
|
|
|
|
Year ended December 31, |
||||
|
|
2014 |
|
2013 |
|
2012 |
|
|
|
|
|
|
|
|
Cash provided by (used in) |
|
|
|
|
|
|
Operating activities |
|
|
|
|
|
|
Net loss for the year |
(8,749) |
|
(30,353) |
|
(17,558) |
|
Items not affecting cash: |
|
|
|
|
|
|
Stock based expense |
928 |
|
1,153 |
|
2,410 |
|
Depreciation and amortization |
7,643 |
|
537 |
|
530 |
|
Non-cash interest expense |
- |
|
3,881 |
|
- |
|
Accretion expense |
497 |
|
27 |
|
- |
|
Provision for reclamation |
- |
|
9 |
|
(97) |
|
Write off of investments |
- |
|
1,006 |
|
- |
|
Write-off of mineral properties |
483 |
|
1,430 |
|
- |
|
Warrants mark to market gain |
(946) |
|
- |
|
- |
|
Foreign exchange loss (gain) |
- |
|
(156) |
|
383 |
|
Loss (gain) on disposition of assets |
- |
|
1 |
|
(968) |
|
Other loss |
3 |
|
18 |
|
68 |
|
Deferred revenue realized |
(2,508) |
|
- |
|
|
|
RSUs redeemed for cash |
(66) |
|
(64) |
|
(19) |
|
Proceeds from assignment of sales contract |
- |
|
2,508 |
|
- |
|
Change in non-cash working capital items: |
|
|
|
|
|
|
Accounts receivable |
5,772 |
|
(5,720) |
|
(1) |
|
Inventory |
(3,115) |
|
(1,433) |
|
- |
|
Prepaid expenses |
259 |
|
(1,414) |
|
(85) |
|
Accounts payable and accrued liabilities |
1,736 |
|
800 |
|
615 |
|
|
1,937 |
|
(27,770) |
|
(14,722) |
|
|
|
|
|
|
|
|
Investing activities |
|
|
|
|
|
|
Mineral property costs |
(65) |
|
(5,319) |
|
(320) |
|
Purchase of short-term investments |
- |
|
- |
|
(10,195) |
|
Sale of short-term investments |
- |
|
6,593 |
|
10,631 |
|
Increase in restricted cash |
(2,500) |
|
(3,001) |
|
2,198 |
|
Deposit for Pathfinder acquisition |
- |
|
- |
|
(1,338) |
|
Funding of equity investment |
(7) |
|
(9) |
|
(27) |
|
Purchase of capital assets |
(436) |
|
(23,990) |
|
(6,958) |
|
|
(3,008) |
|
(25,726) |
|
(6,009) |
|
|
|
|
|
|
|
|
Financing activities |
|
|
|
|
|
|
Issuance of common shares and warrants for cash |
- |
|
5,482 |
|
17,210 |
|
Share issue costs |
(50) |
|
(238) |
|
(1,003) |
|
Proceeds from exercise of stock options |
1,347 |
|
275 |
|
75 |
|
Proceeds from debt financing |
5,000 |
|
75,100 |
|
- |
|
Cost of debt financing |
(135) |
|
(403) |
|
- |
|
Repayment of debt |
(3,585) |
|
(36,425) |
|
(28) |
|
|
2,577 |
|
43,791 |
|
16,254 |
|
|
|
|
|
|
|
|
Effects of foreign exchange rate changes on cash |
(29) |
|
(204) |
|
159 |
|
Net change in cash and cash equivalents |
1,477 |
|
(9,909) |
|
(4,318) |
|
Beginning cash and cash equivalents |
1,627 |
|
11,536 |
|
15,854 |
|
Ending cash and cash equivalents |
3,104 |
|
1,627 |
|
11,536 |
|
Total Interest paid |
2,526 |
|
1,056 |
|
3 |
The accompanying notes are an integral part of these consolidated financial statements